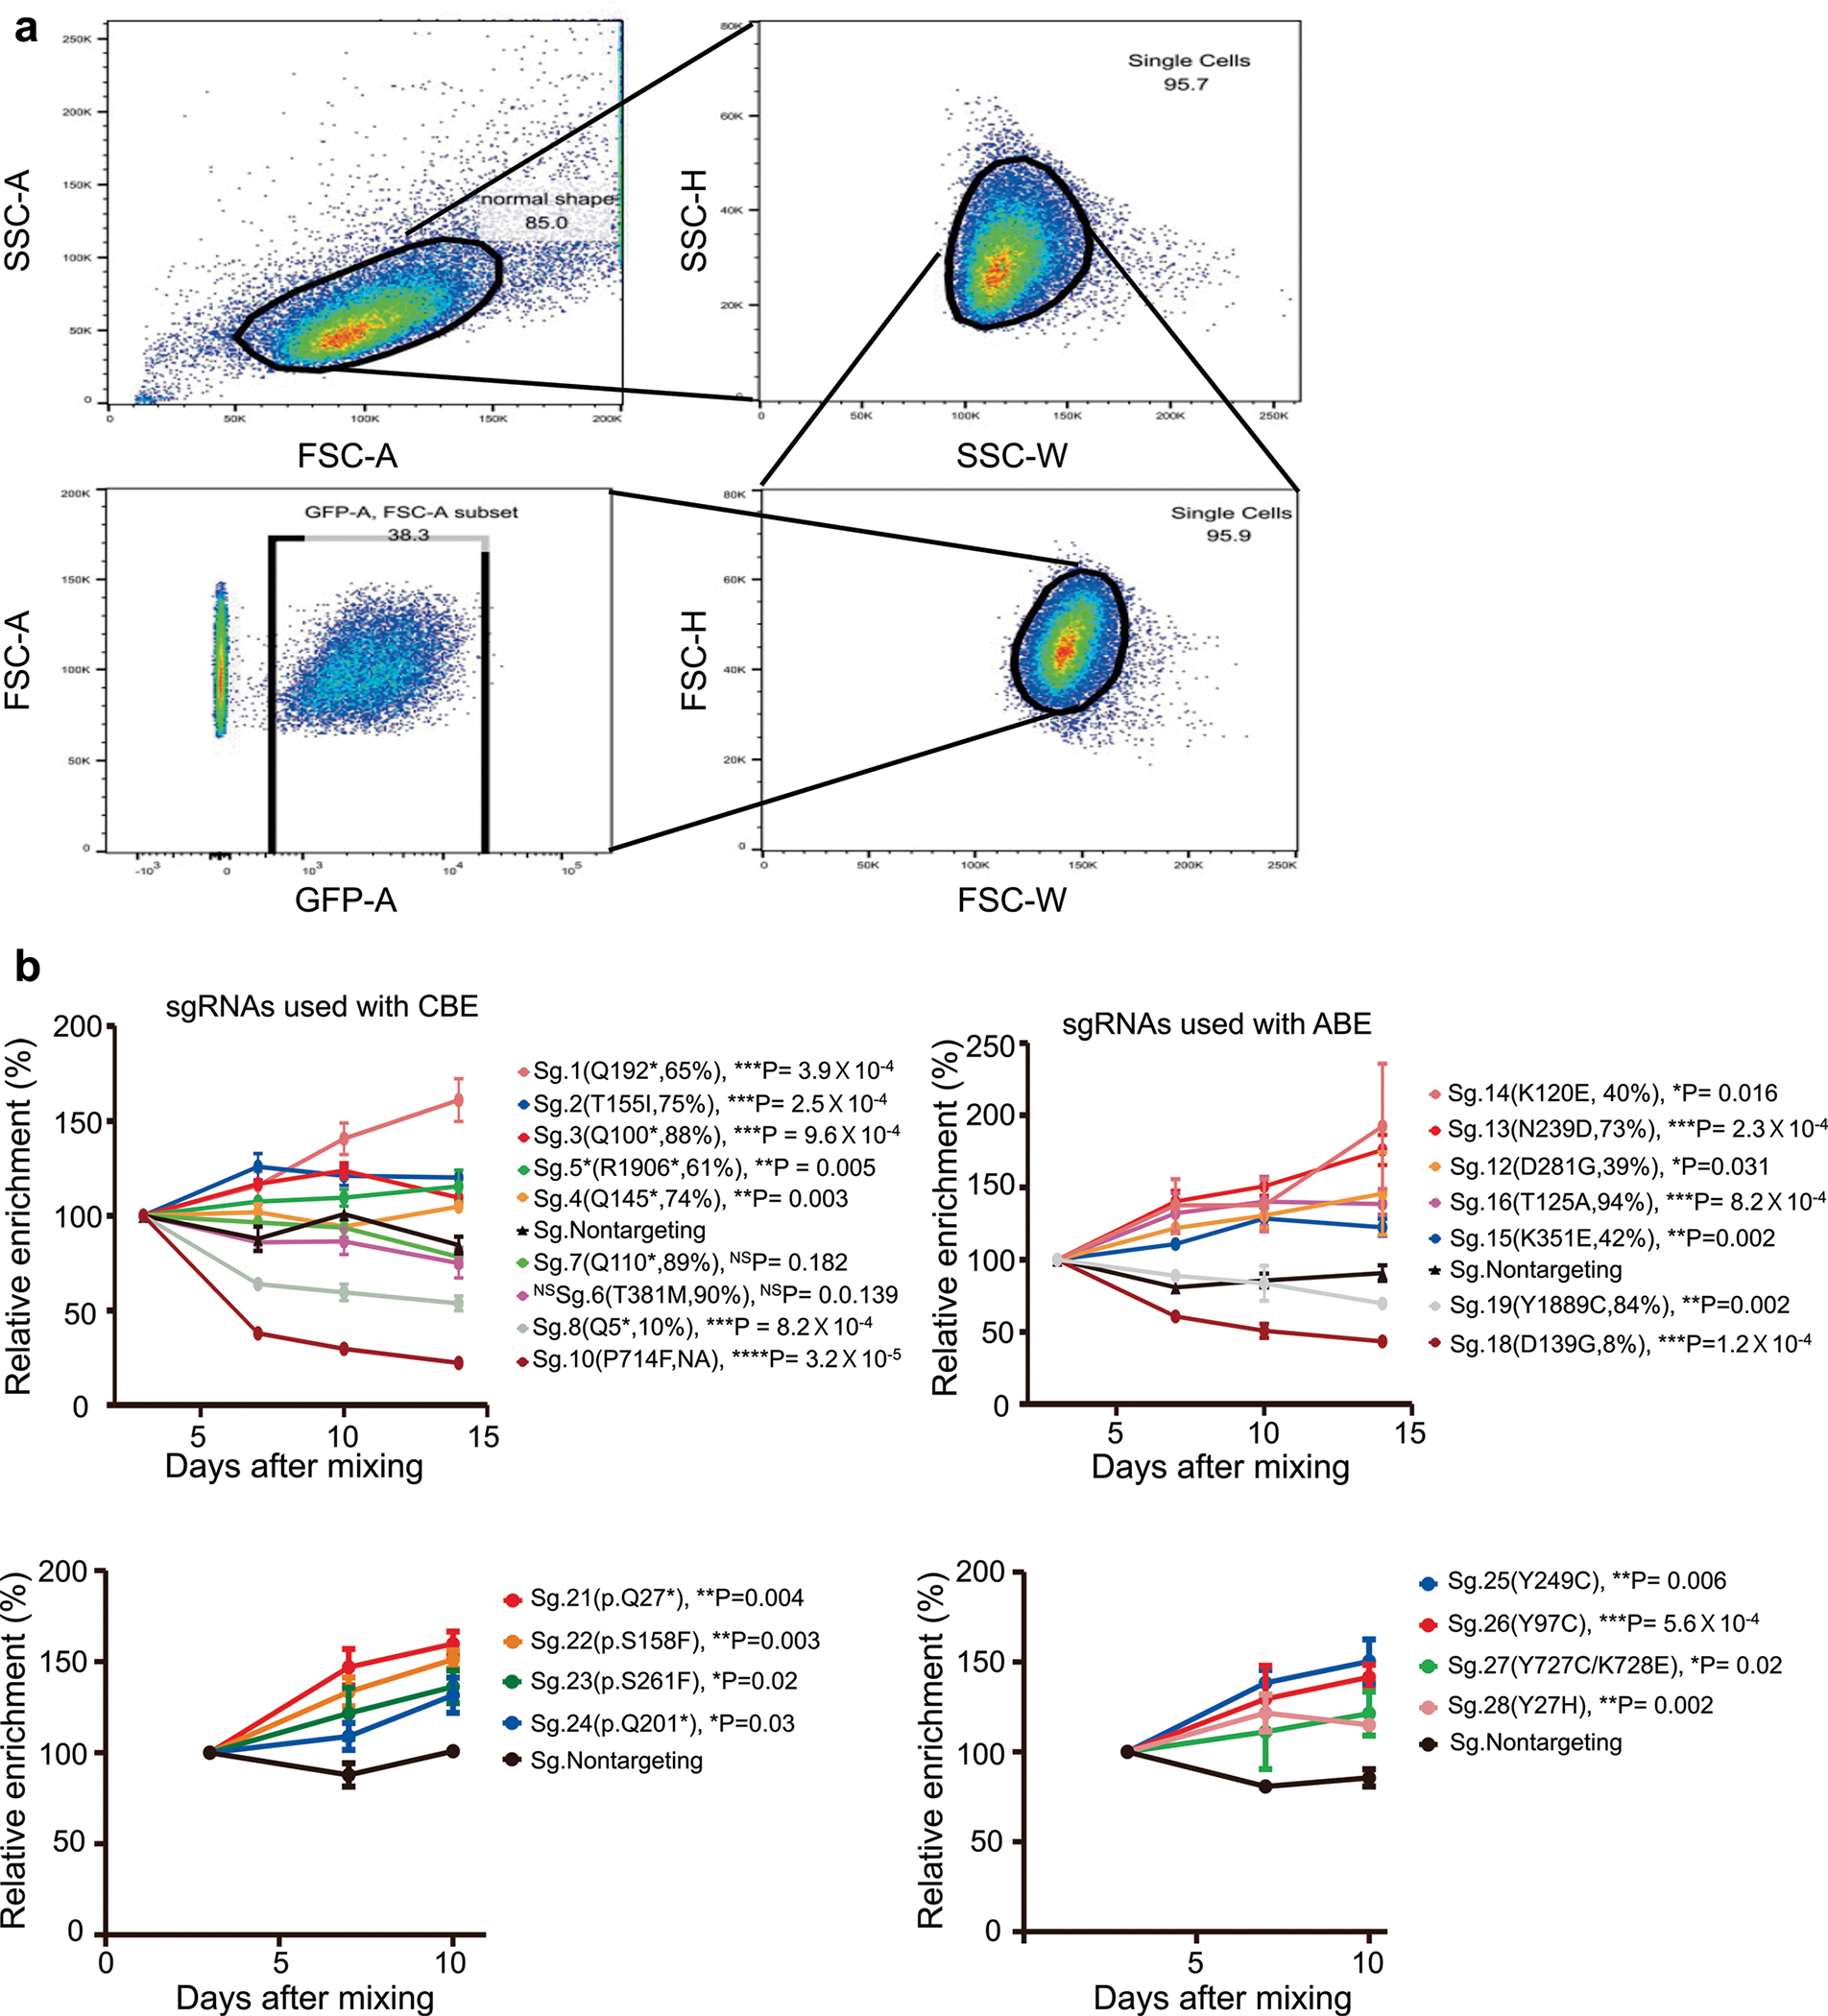
Extended Data Fig. 9 |. The results of competitive proliferation assays.

a, An example for flow cytometry gating strategy used in the competitive proliferation assays. b, Mean relative enrichment values ± standard deviation of three replicates. Student’s t test was performed under the null hypothesis that the proportions of sgRNA-transduced and nontargeting sgRNA-transduced cells would be the same. Two nontargeting sgRNAs were used as the control and the mean values of relative enrichment were used as the control.
