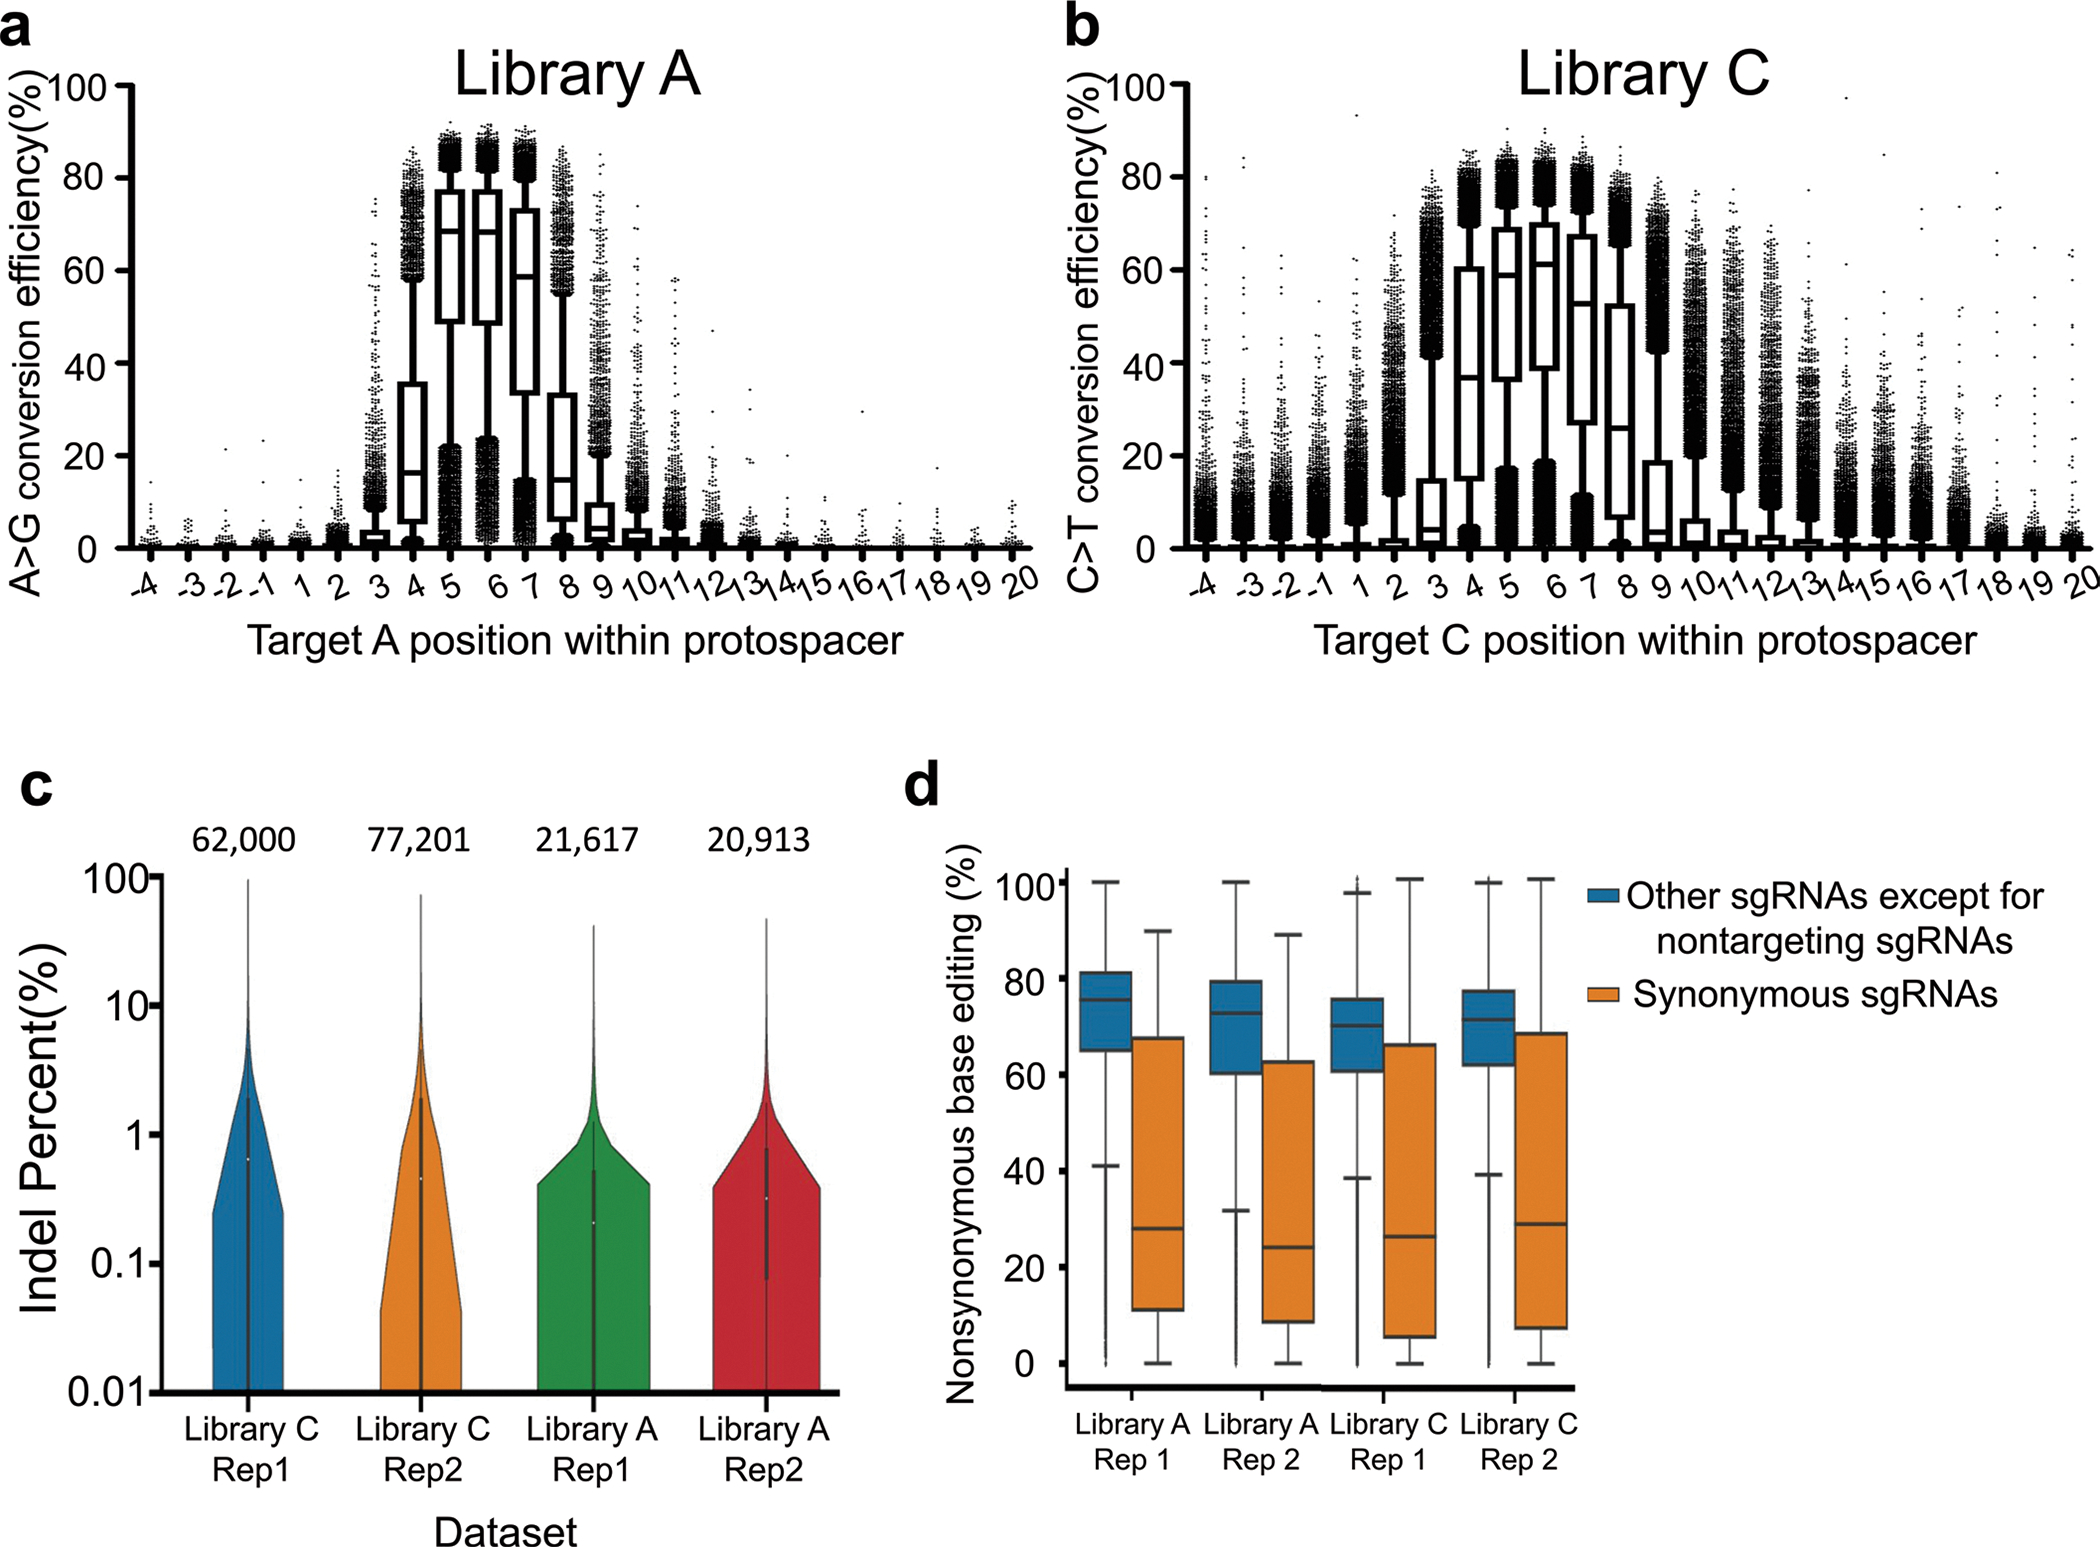
Extended Data Fig. 3 |. Base editing efficiencies and indel frequencies at integrated target sequences.

Base editing efficiencies measured at each position in the indicated region for target nucleotide Cs (a) or As (b) in integrated surrogate target sequences. Position 1 is the 5’ end of the target sequence and position 20 is immediately upstream of the NGG PAM. The numbers of analyzed target sequences (n) are as follows: n = 5,865 (position −4), 5,393 (position −3), 5,782 (position −2), 5,815 (position −1), 5,292 (position 1), 5,614 (position 2), 5,697, 6,394, 10,586, 9,382, 8,837, 5,421, 6,130, 5,339, 5,541, 5,796, 5,058, 5,723, 5,955, 5,348, 5,779, 5,437, 4,884, 5,502 (position 20) for ABE (a); n = 19,475 (position −4), 20,753 (position −3), 20,110 (position −2), 19,425 (position −1), 19,984 (position 1), 20,004 (position 2), 17,873, 24,870, 35,421, 33,186, 32,807, 19,895, 19,195, 20,227, 19,549, 18,986, 20,367, 18,793, 18,361, 20,478, 19,605, 20,975, 21,542, 22,952 (position 20) for CBE (b). Boxplots are represented as follows: center line of box indicating the median, box limits indicating the upper and lower quartile; whiskers show the 10th and 90th percentiles. Outliers are shown using dots. c, Indel frequencies measured 10 days after the transduction of sgRNA target pairs. The number of analyzed target sequence is indicated at the top of each dataset. (n = 62,000 (Library C, Replicate 1), 77,201 (Library C, Replicate 2), 21,617 (Library A, Replicate 1) and 20,913 (Library A, Replicate 2). Boxplots are represented as follows: center white dot of box indicating the median, box limits indicating the upper and lower quartile; the distributions of indel frequencies are represented with kernel densities. d, Nonsynonymous base editing efficiencies at the integrated target sequences of synonymous control sgRNAs and other sgRNAs in the given datasets. The number of synonymous and other sgRNAs are as follows; 431 and 21,055 (Library A, Replicate 1), 413 and 20,372 (Library A, Replicate 2), 2,272 and 59,390 (Library C, Replicate 1), and 2,795 and 73,691 (Library C, replicate 2), respectively. Boxplots are represented as follows: center line of box indicating the median, box limits indicating the upper and lower quartile; whiskers show the 1.5 times interquartile range.
