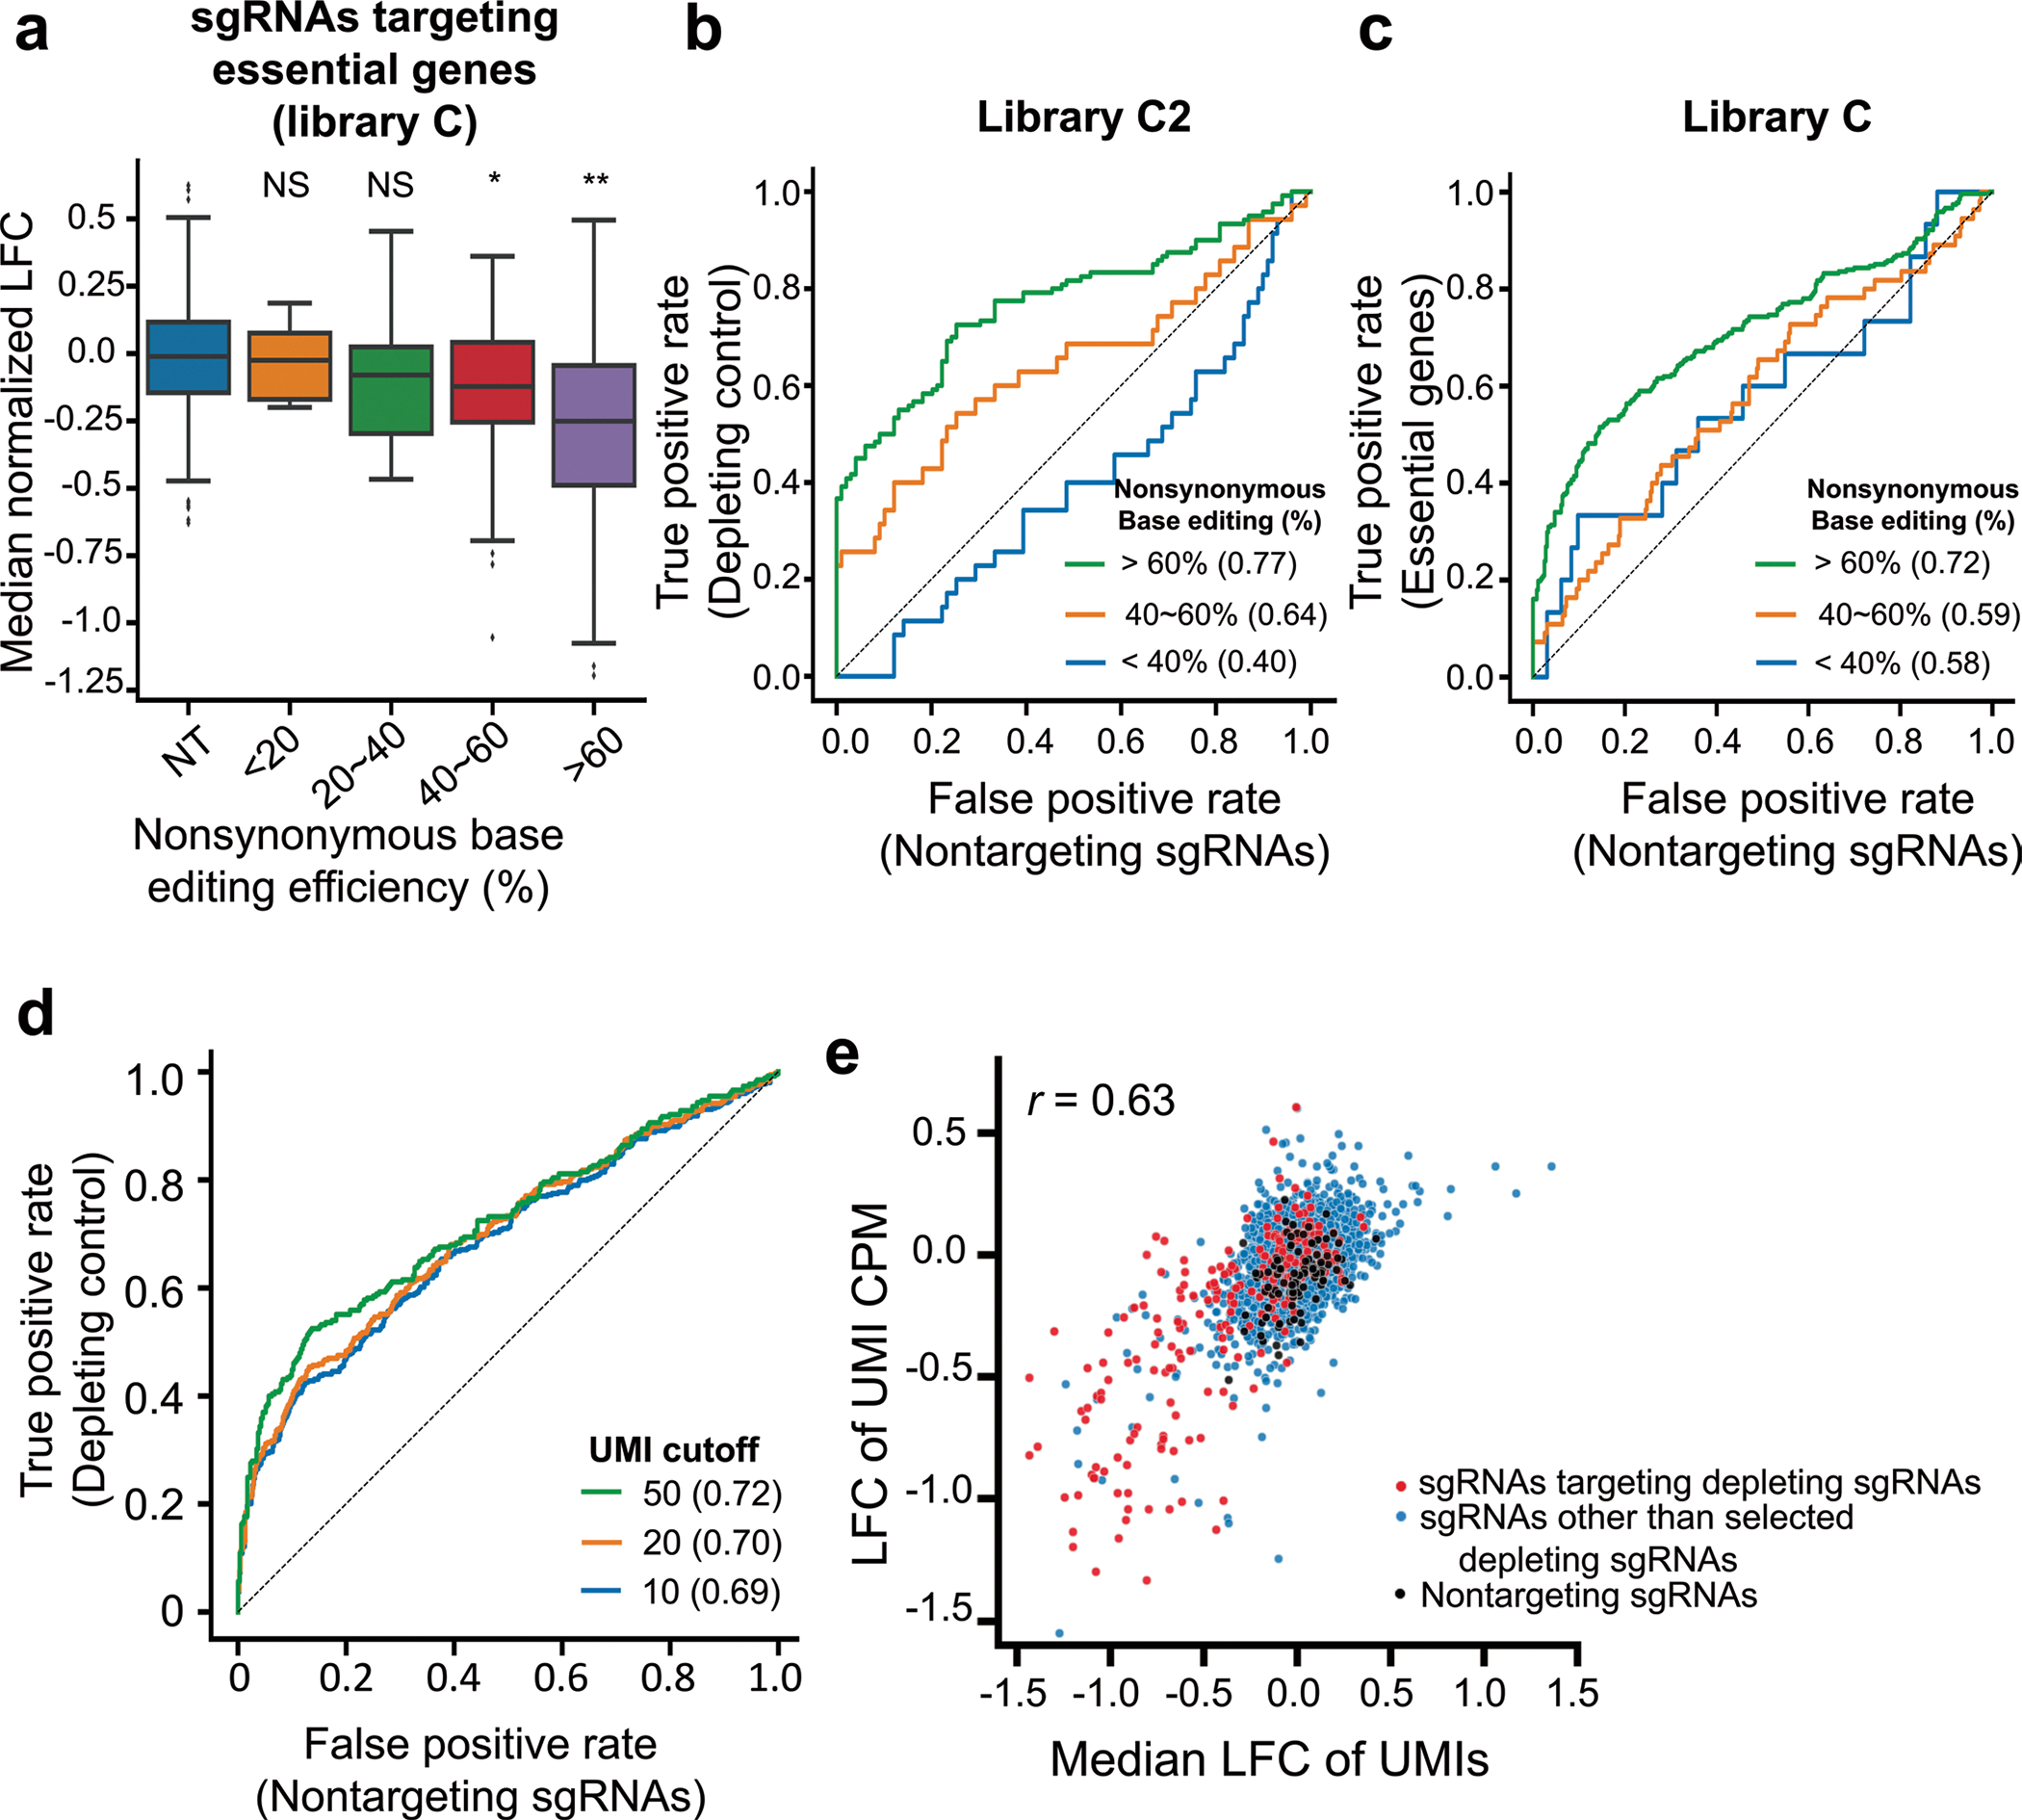
Extended Data Fig. 4 |. Performance of high-throughput evaluations.

a, Distribution of median normalized log fold changes (LFCs) of 338 sgRNAs targeting essential genes depending on the nonsynonymous base editing efficiencies determined at the integrated target sequences in library C2. NT, nontargeting sgRNAs. The number of sgRNAs n = 359 (NT), 5 (<20%), 10 (20%~40%), 55 (40%~60%), 268 (>60%). Boxplots are represented as follows: center line of box indicating the median, box limits indicating the upper and lower quartile; whiskers show the 1.5 times interquartile range. (in comparison with NT, student’s t-test; NS, not significant, *P = 1.5 × 10⁻⁴, **P = 2.2 × 10⁻³²). b,c, Receiver operating characteristic-area under the curve (ROC-AUC) analysis of LFCs for sgRNAs predicted to induce stop codons in common essential genes versus nontargeting sgRNAs in library C2 (b) and library C (c) at increasing thresholds of nonsynonymous base editing efficiencies. AUC values are indicated in parentheses. d, ROC-AUC analysis of LFCs for sgRNAs predicted to induce stop codons in common essential genes versus nontargeting controls at increasing thresholds of the number of UMIs in each sgRNA in library C. An area under curve for each UMI cutoff is shown in the parenthesis. e, Correlations between median LFCs of UMIs for sgRNAs and LFCs of UMI CPM (counts per million) for the same sgRNAs in library C2. Red dots indicate sgRNAs predicted to induce nonsense mutations in selected common essential genes. The number of sgRNAs n = 3,229 (merged), 2,913 (other sgRNAs, blue dots), 217 (sgRNAs targeting essential genes, red dots), 99 (nontargeting sgRNAs, black dots). Pearson correlation coefficients (r) are shown.
