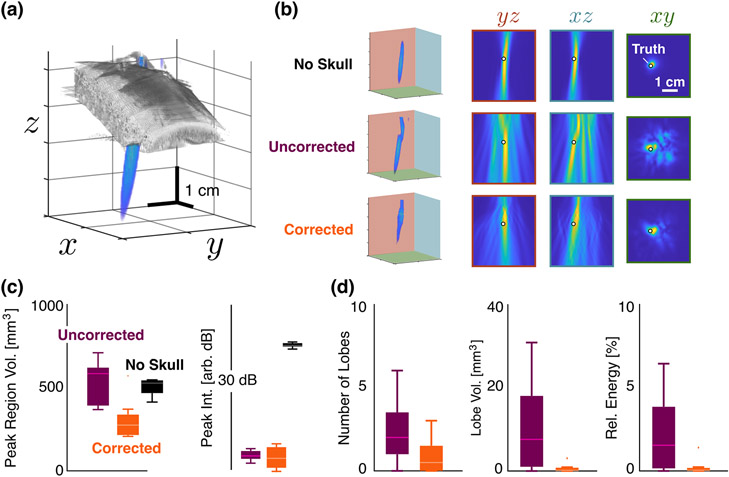
Fig. 3.
Comparison of PAM Quality. (a) Experimental reconstructed PAM relative to the position and size of the skull. (b) Reconstructed maps for positions (0, 5, 30) mm with no skull (top row), with the skull (i.e., uncorrected, middle row), and with the skull and correction (bottom row). The columns show the projections of the maps onto the indicated axes relative to the true position of the source (white circle). The 1 cm scale bar is constant for all PAMs. (c) Mean peak region volume and PAM intensities at the peak averaged over all positions for the no-skull (black), uncorrected (purple), and corrected (orange) cases. Scale bar in plane of top row is constant for all images. (d) Mean number, volume, and total energy within the side lobes averaged over all cases. No side lobes were present in the no skull case.

