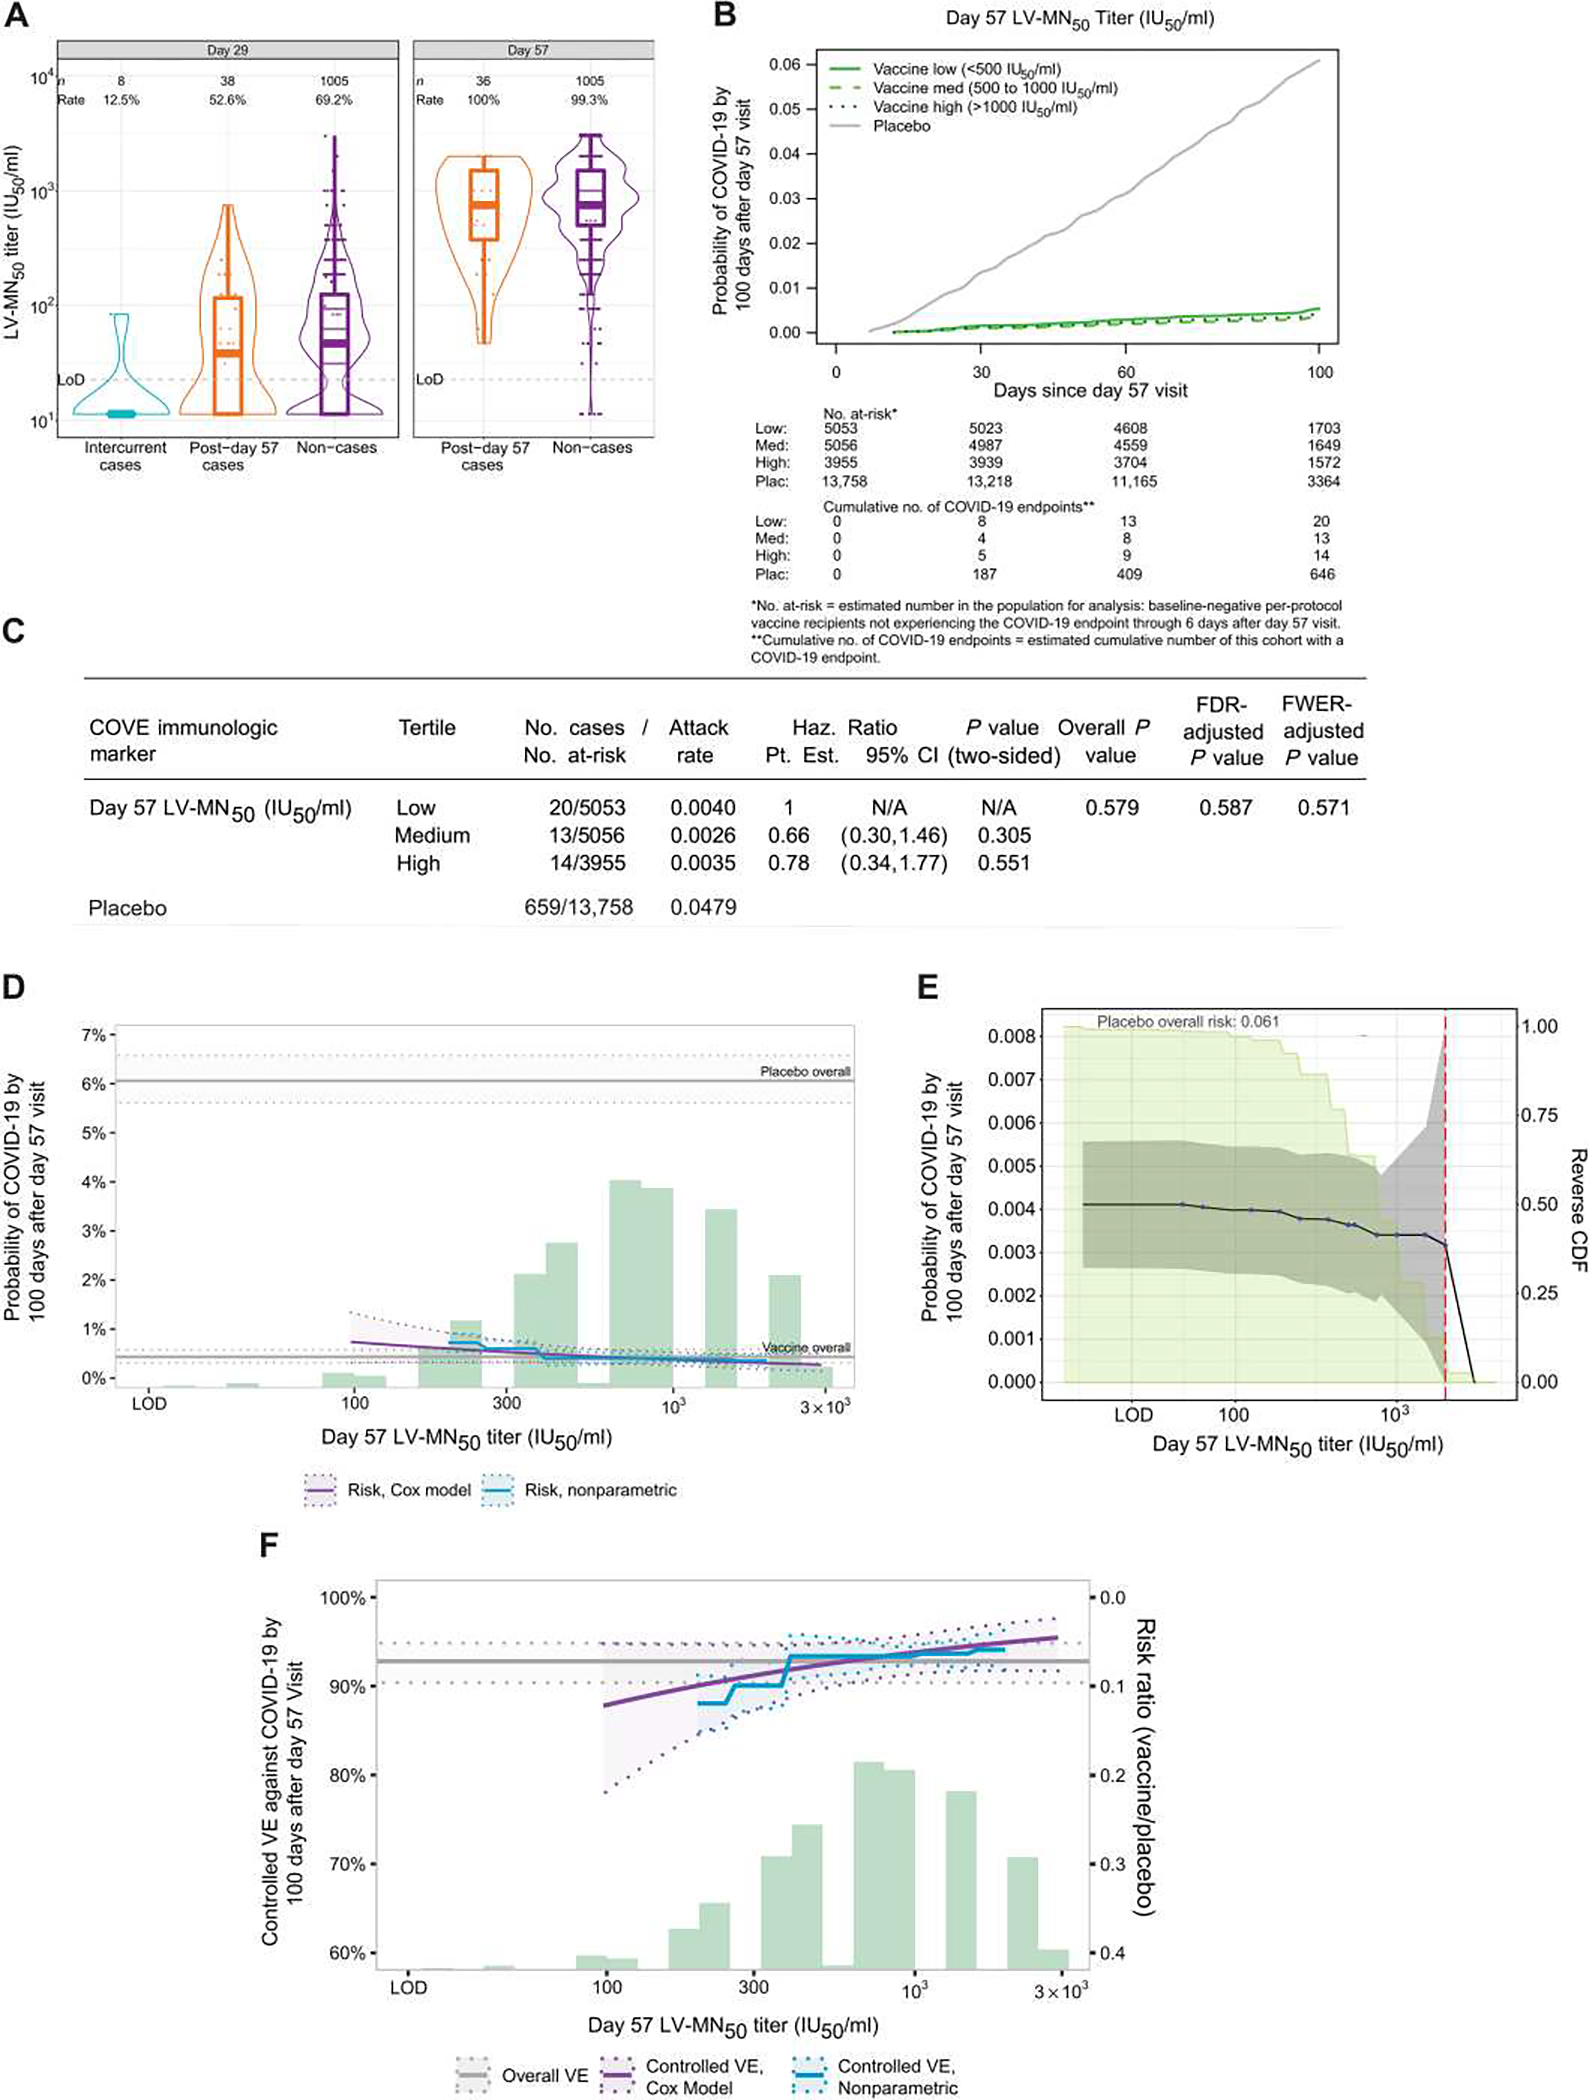
Fig. 2. Correlate analyses show limited evidence for D57 LV-MN50 titer as a CoR and as a CoP.

(A) LV-MN50 titers are shown binned by COVID-19 outcome status in baseline SARS-CoV-2–negative per-protocol vaccine recipients. Each sample was tested independently in singlet by one operator on one test plate following the standard operator procedures. The same sample was then tested by a second operator in singlet on a different plate on the same day. If necessary, repeat testing of any samples was performed in singlet by one operator on a different test day. The final reportable value for each sample was the median LV-MN50 titer of a minimum of two passing independent results. Data points are from the D29 marker or D57 marker case-cohort set. The violin plots contain interior box plots with upper and lower horizontal edges being the 25th and 75th percentiles of antibody concentrations, respectively, and the middle line being the 50th percentile; the vertical bars show the distance from the 25th (or 75th) percentile of antibody concentration and the minimum (or maximum) antibody concentration within the 25th (or 75th) percentile of antibody concentration minus (or plus) 1.5 times the interquartile range. Each side shows a rotated probability density (estimated by a kernel density estimator with a default Gaussian kernel) of the data. Positive response rates were computed with inverse probability of sampling weighting. Positive response was defined by value > LoD (22.66 IU50/ml). Post-D57 cases are COVID-19 endpoints starting 7 days after D57 through the end of blinded follow-up (last COVID-19 endpoint 126 days after dose 2); intercurrent cases are COVID-19 endpoints starting 7 days after D29 through 6 days after D57. IU, international units; LoD, limit of detection. (B) Shown is the cumulative incidence of COVID-19 for the low, medium, and high tertiles of D57 LV-MN50 titers. (C) Shown are the estimated hazard ratios of COVID-19 for the medium versus low and for the high versus low tertiles of D57 LV-MN50. Both comparisons were made in baseline SARS-CoV-2–negative per-protocol participants. All P values are based on Wald tests; multiplicity adjustments are shown controlling false discovery rate and FWER over the set of P values (separately for D29 and for D57 marker CoRs) both for quantitative markers and categorical markers (considering all five antibody markers: spike IgG, RBD IgG, PsV-nAb ID50, PsV-nAb ID80, and LV-MN50) using the Westfall and Young (34) permutation method (10,000 replicates). The overall P value is from a generalized Wald test of whether the hazard rate of COVID-19 differed across the low, medium, and high subgroups. N/A, not applicable. (D) Shown is the cumulative incidence of COVID-19 by 100 days after D57 by D57 LV-MN50 titer, estimated using (solid purple line) a Cox model or (solid blue line) a nonparametric model. Purple dotted lines indicate the bootstrap point-wise 95% CIs; blue dotted lines indicate the influence function–based Wald-based 95% confidence intervals (CIs). Upper and lower horizontal gray lines indicate overall cumulative incidence of COVID-19 from 7 to 100 days after D57 in placebo and vaccine recipients, respectively. The green histogram indicates the frequency distribution of D57 marker among baseline SARS-CoV-2–negative per-protocol vaccine recipients. (E) Shown is the cumulative incidence of COVID-19 by 100 days after D57 by D57 LV-MN50titer PsV-nAb ID50 titer above a threshold [versus at a specific threshold, as in (D)]. Blue dots indicate point estimates at each COVID-19 primary endpoint linearly interpolated by solid black lines; gray shading indicates point-wise 95% CIs. The estimates and CIs assume a nonincreasing threshold-response function. The upper boundary of the green shaded area indicates the estimate of the reverse cumulative distribution function (CDF) of D57 LV-MN50 concentrations. The vertical red dashed line indicates the D57 LV-MN50 occurred (in the time frame of 7 days after D57 through to the data cutoff date of 26 March 2021). (F) Shown is vaccine efficacy by D57 LV-MN50 titer estimated by different implementations of (30). The solid purple line indicates vaccine efficacy by D57 LV-MN50 titer, estimated using a Cox proportional hazard implementation of (30); dotted purple lines indicate bootstrap point-wise 95% CIs. The solid blue line indicates vaccine efficacy by D57 LV-MN50 titer, estimated using a nonparametric implementation of (30); dotted blue lines indicate 95% CIs. The green histogram indicates the frequency distribution of D57 marker among baseline SARS-CoV-2–negative per-protocol vaccine recipients. The horizontal gray line indicates overall vaccine efficacy from 7 to 100 days after D57, and the dotted gray lines indicates 95% CIs. Analyses were adjusted for baseline risk score, at-risk status, and community of color status. Microneutralization assay readouts were calibrated to the WHO anti–SARS-CoV-2 immunoglobulin International Standard (27) and are expressed in IU50/ml.
