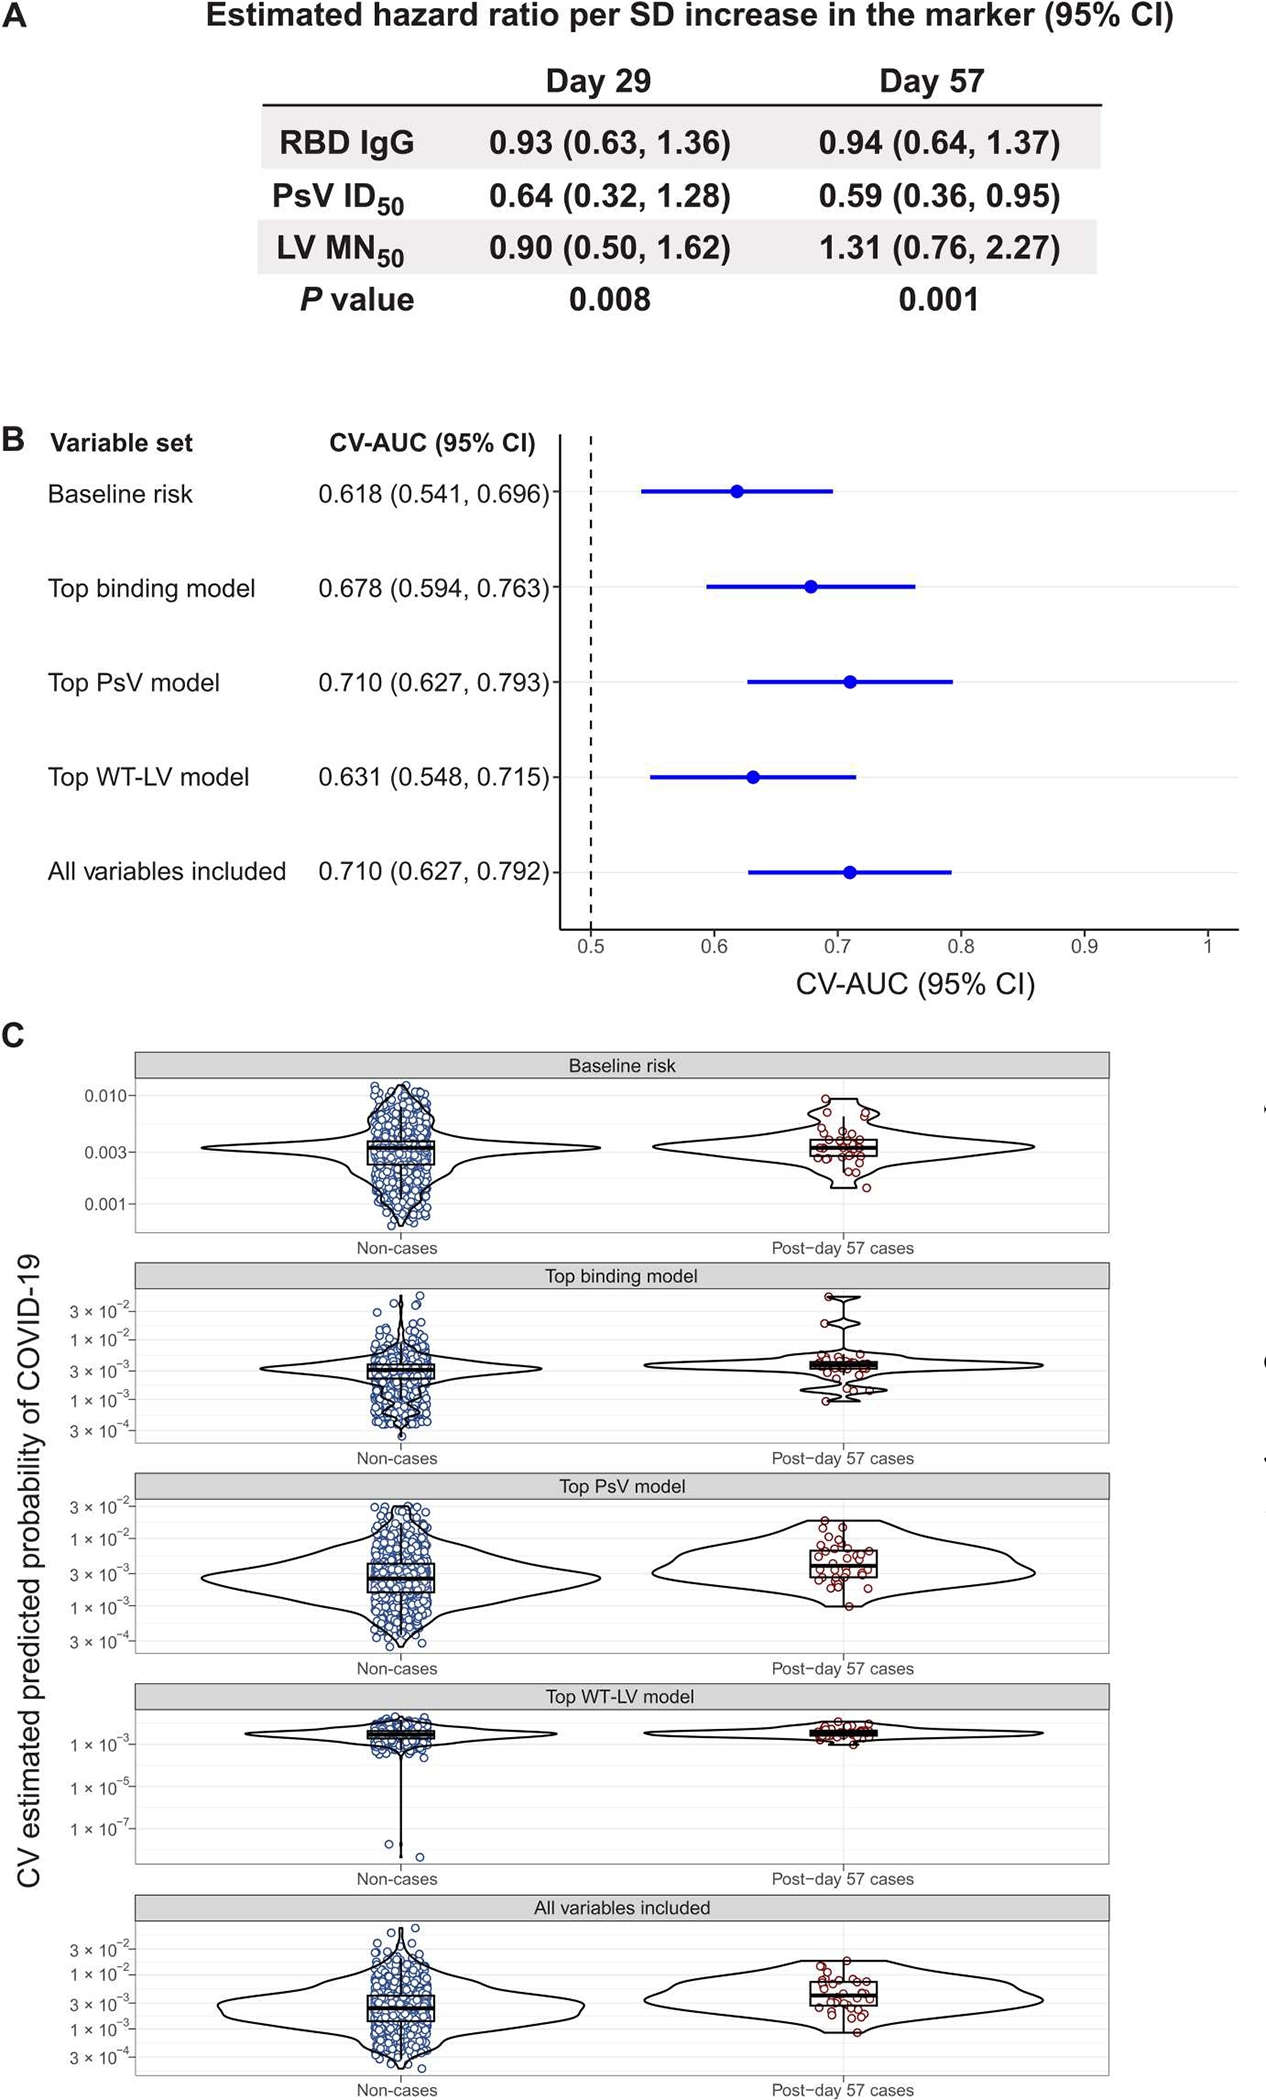
Fig. 3. Multivariable modeling of COVID-19 risk shows that PsV neutralization titers and anti-spike bAbs perform best as CoRs, with no improvement in performance by including multiple markers.

(A) Shown is the estimated COVID-19 hazard ratio per SD increase of the indicated antibody marker value in baseline SARS-CoV-2–negative per-protocol vaccine recipients. Hazard ratio was assessed using multivariable models. The two-phase sampling Cox model was adjusted for baseline risk score, at-risk status, and community of color status. The P values are from a generalized Wald test of the null hypothesis that all assay marker variables have null association. (B) The forest plot shows discrete Super Learner performance (weighted CV-AUC with 95% CI) for baseline risk factors, the top binding model, the top PsV-nAb model, the top wild-type live virus (WT-LV)–nAb model, and the model including all marker variables. All models include the baseline risk factors. The top binding model includes D57 bAb spike IgG, the top PsV-nAb model includes D29 and D57 PsV-nAb ID80, and the top LV-MN50 model includes D57 LV-MN50. The dashed vertical line indicates a CV-AUC of 0.5 (the prediction performance achieved by random guessing). (C) Shown are the distributions of weighted CV-estimated prediction probabilities for post-D57 cases (n = 36) and non-cases (n = 1005) using discrete Super Learner for baseline risk factors, the top binding model, the top PsV-nAb model, the top WT-LV-MN50 model, and the model including all marker variables. Post-D57 cases are COVID-19 endpoints starting 7 days after D57 through the end of blinded follow-up (last COVID-19 endpoint 126 days after dose 2). Serological assay readouts assessed as immune correlates were first expressed in values relative to the WHO International Standard for anti–SARS-CoV-2 immunoglobulin (27). bAb readouts were converted to BAU/ml, and PsV-nAb titers and microneutralization assay readouts were calibrated to IU50/ml or IU80/ml. CV-AUC, cross-validated area under the receiver operating characteristic curve.
