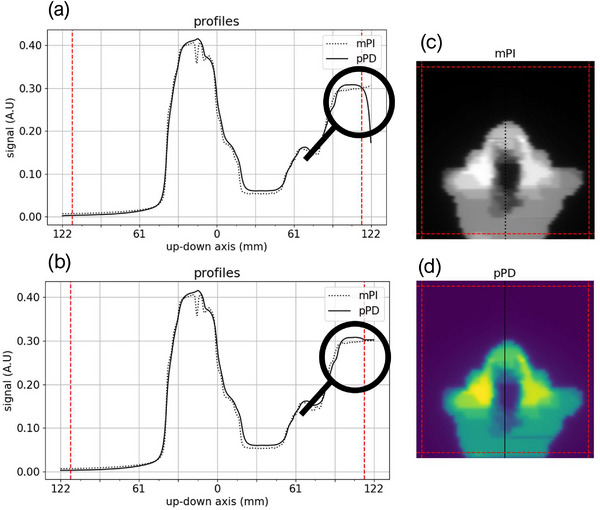
FIGURE 2.

mPI (c), pPD (d) and their up‐down profiles centered on the beam axis before (a) and after (b) the edge correction for a Head & Neck IMRT S&S training beam. On each side of the profiles and images, the dashed red line represents the crop boundary applied on mPIs and pPDs.
