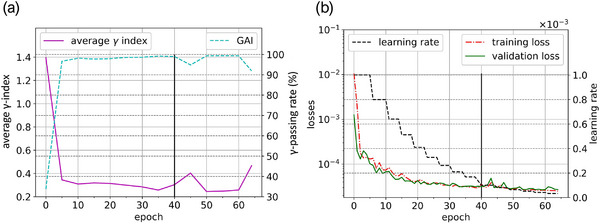
FIGURE 7.

Training history of the 5th model composed of the learning rate, the training and validation losses (a), the average γ‐index and the average ϒ‐passing rate (b). On the two graphs, at the 40th epoch (vertical line), the TDM was computed and added to the U‐net output.
