FIGURE 8.

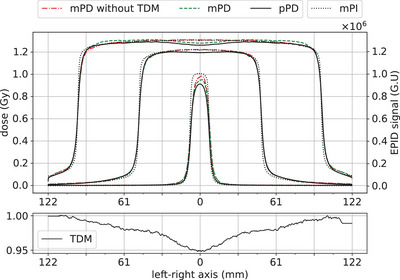
Left‐right profiles centered on the beam axis of mPIs in grayscale units (G.U), TDM (bottom graph), pPDs, and mPDs of the U‐net and U‐netTDM for square beams of 15 mm, 100 mm, and 200 mm side.

Left‐right profiles centered on the beam axis of mPIs in grayscale units (G.U), TDM (bottom graph), pPDs, and mPDs of the U‐net and U‐netTDM for square beams of 15 mm, 100 mm, and 200 mm side.