
FIGURE 2.
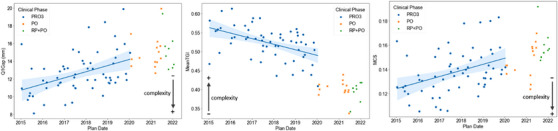
Scatter plots of Q1Gap, MeanTGI, and MCS over time grouped by clinical phase. A linear fit is also presented for the PRO3 phase only. The shaded area represents the 95% confidence interval of the estimated regression. Spearman's r coefficients and p‐values for Q1Gap, MeanTGI, and MCS are: r = 0.44 (p < 0.01), r = −0.50 (p < 0.01), and r = 0.43 (p < 0.01), respectively. MCS, Modulation Complexity Score; MeanTGI, Mean Tongue and Groove Index; PO, Photon Optimizer; PRO3, Progressive Resolution Optimizer 3; RP, RapidPlan.