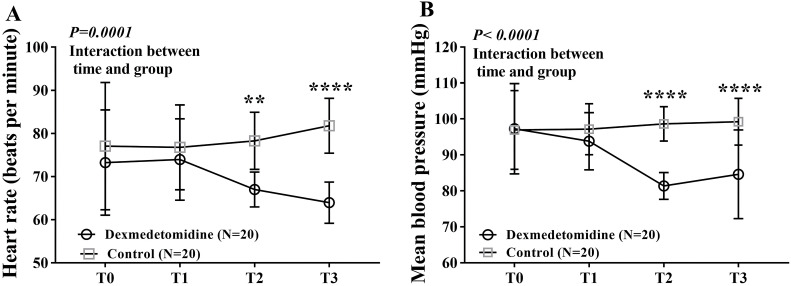
Figure 3.
Changes in HR (A) and MBP (B) at different post-operative timepoints. Repeated-measurement ANOVA shows significant difference in HR over times between the dexmedetomidine group and the control group, with HR at T2 and T3 lower in dexmedetomidine group than in control group. There was a significantly decreased MBP in the dexmedetomidine group vs control group over time. T0, baseline value before anesthesia; T1, at admission to intensive care unit; T2, at zero o’clock on the first postoperative day; T3, at the end of dexmedetomidine infusion, respectively; **P<0.01, ****P<0.0001.

