
Fig. 4.
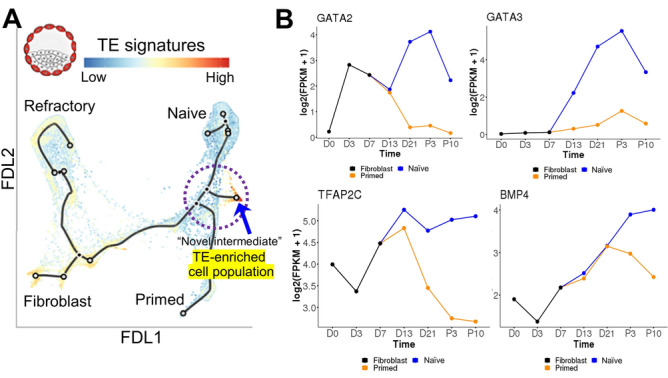
Roadmap for reprogramming human cells. A Either primed or naïve reprogramming trajectories, starting from fibroblast transduced with POU5F1, SOX2, KLF4, and MYC (OSKM). The single cell RNA sequencing (scRNAseq) data were visualized by force-directed layout (FDL), overlaid with in vivo trophectoderm (TE) signatures in color. Red shows high TE signature enrichment as exemplified with an inserted blastocyst drawing. Broken circle represents the intermediate stage of reprogramming.
Modified from Fig. 3A in [131]. B GATA2, GATA3, TFAP2C, and BMP4 gene expressions during reprogramming to naïve and primed human pluripotency prepared from interactive online tool (http://hrpi.ddnetbio.com/) by [131]. Gene expressions are shown in log-transformed log2 (FPKM + 1) and days (D) or passage numbers (P) from the OSKM transduction. Black, blue, and orange lines represent gene expression in fibroblast, naïve (t2iLGoY), and primed medium, respectively