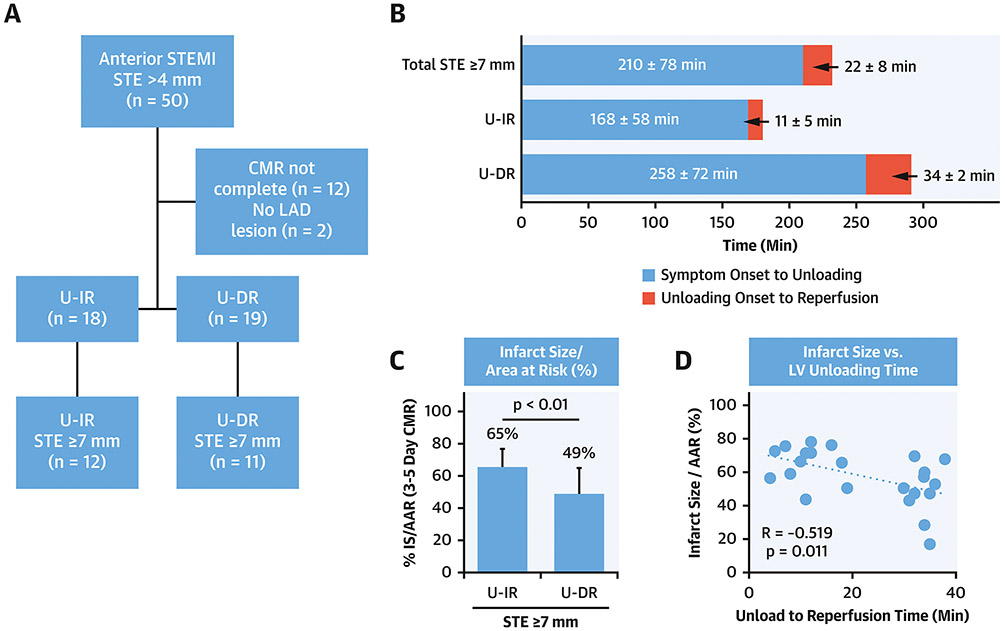
Figure 1. Sub-analysis of the STEMI-DTU Pilot Trial.
A)Flow diagram, B)Duration in minutes for total ischemic time, symptom onset to left ventricular unloading (white bars), and unloading to reperfusion (gray bars) for the total group with ST-segment elevation (STE)>7mm and unloading followed by immediate reperfusion (U-IR) or delayed reperfusion (U-DR); C)Infarct size normalized to the area at risk (IS/AAR); D)Plot comparing IS/AAR and the duration of unloading before reperfusion.

