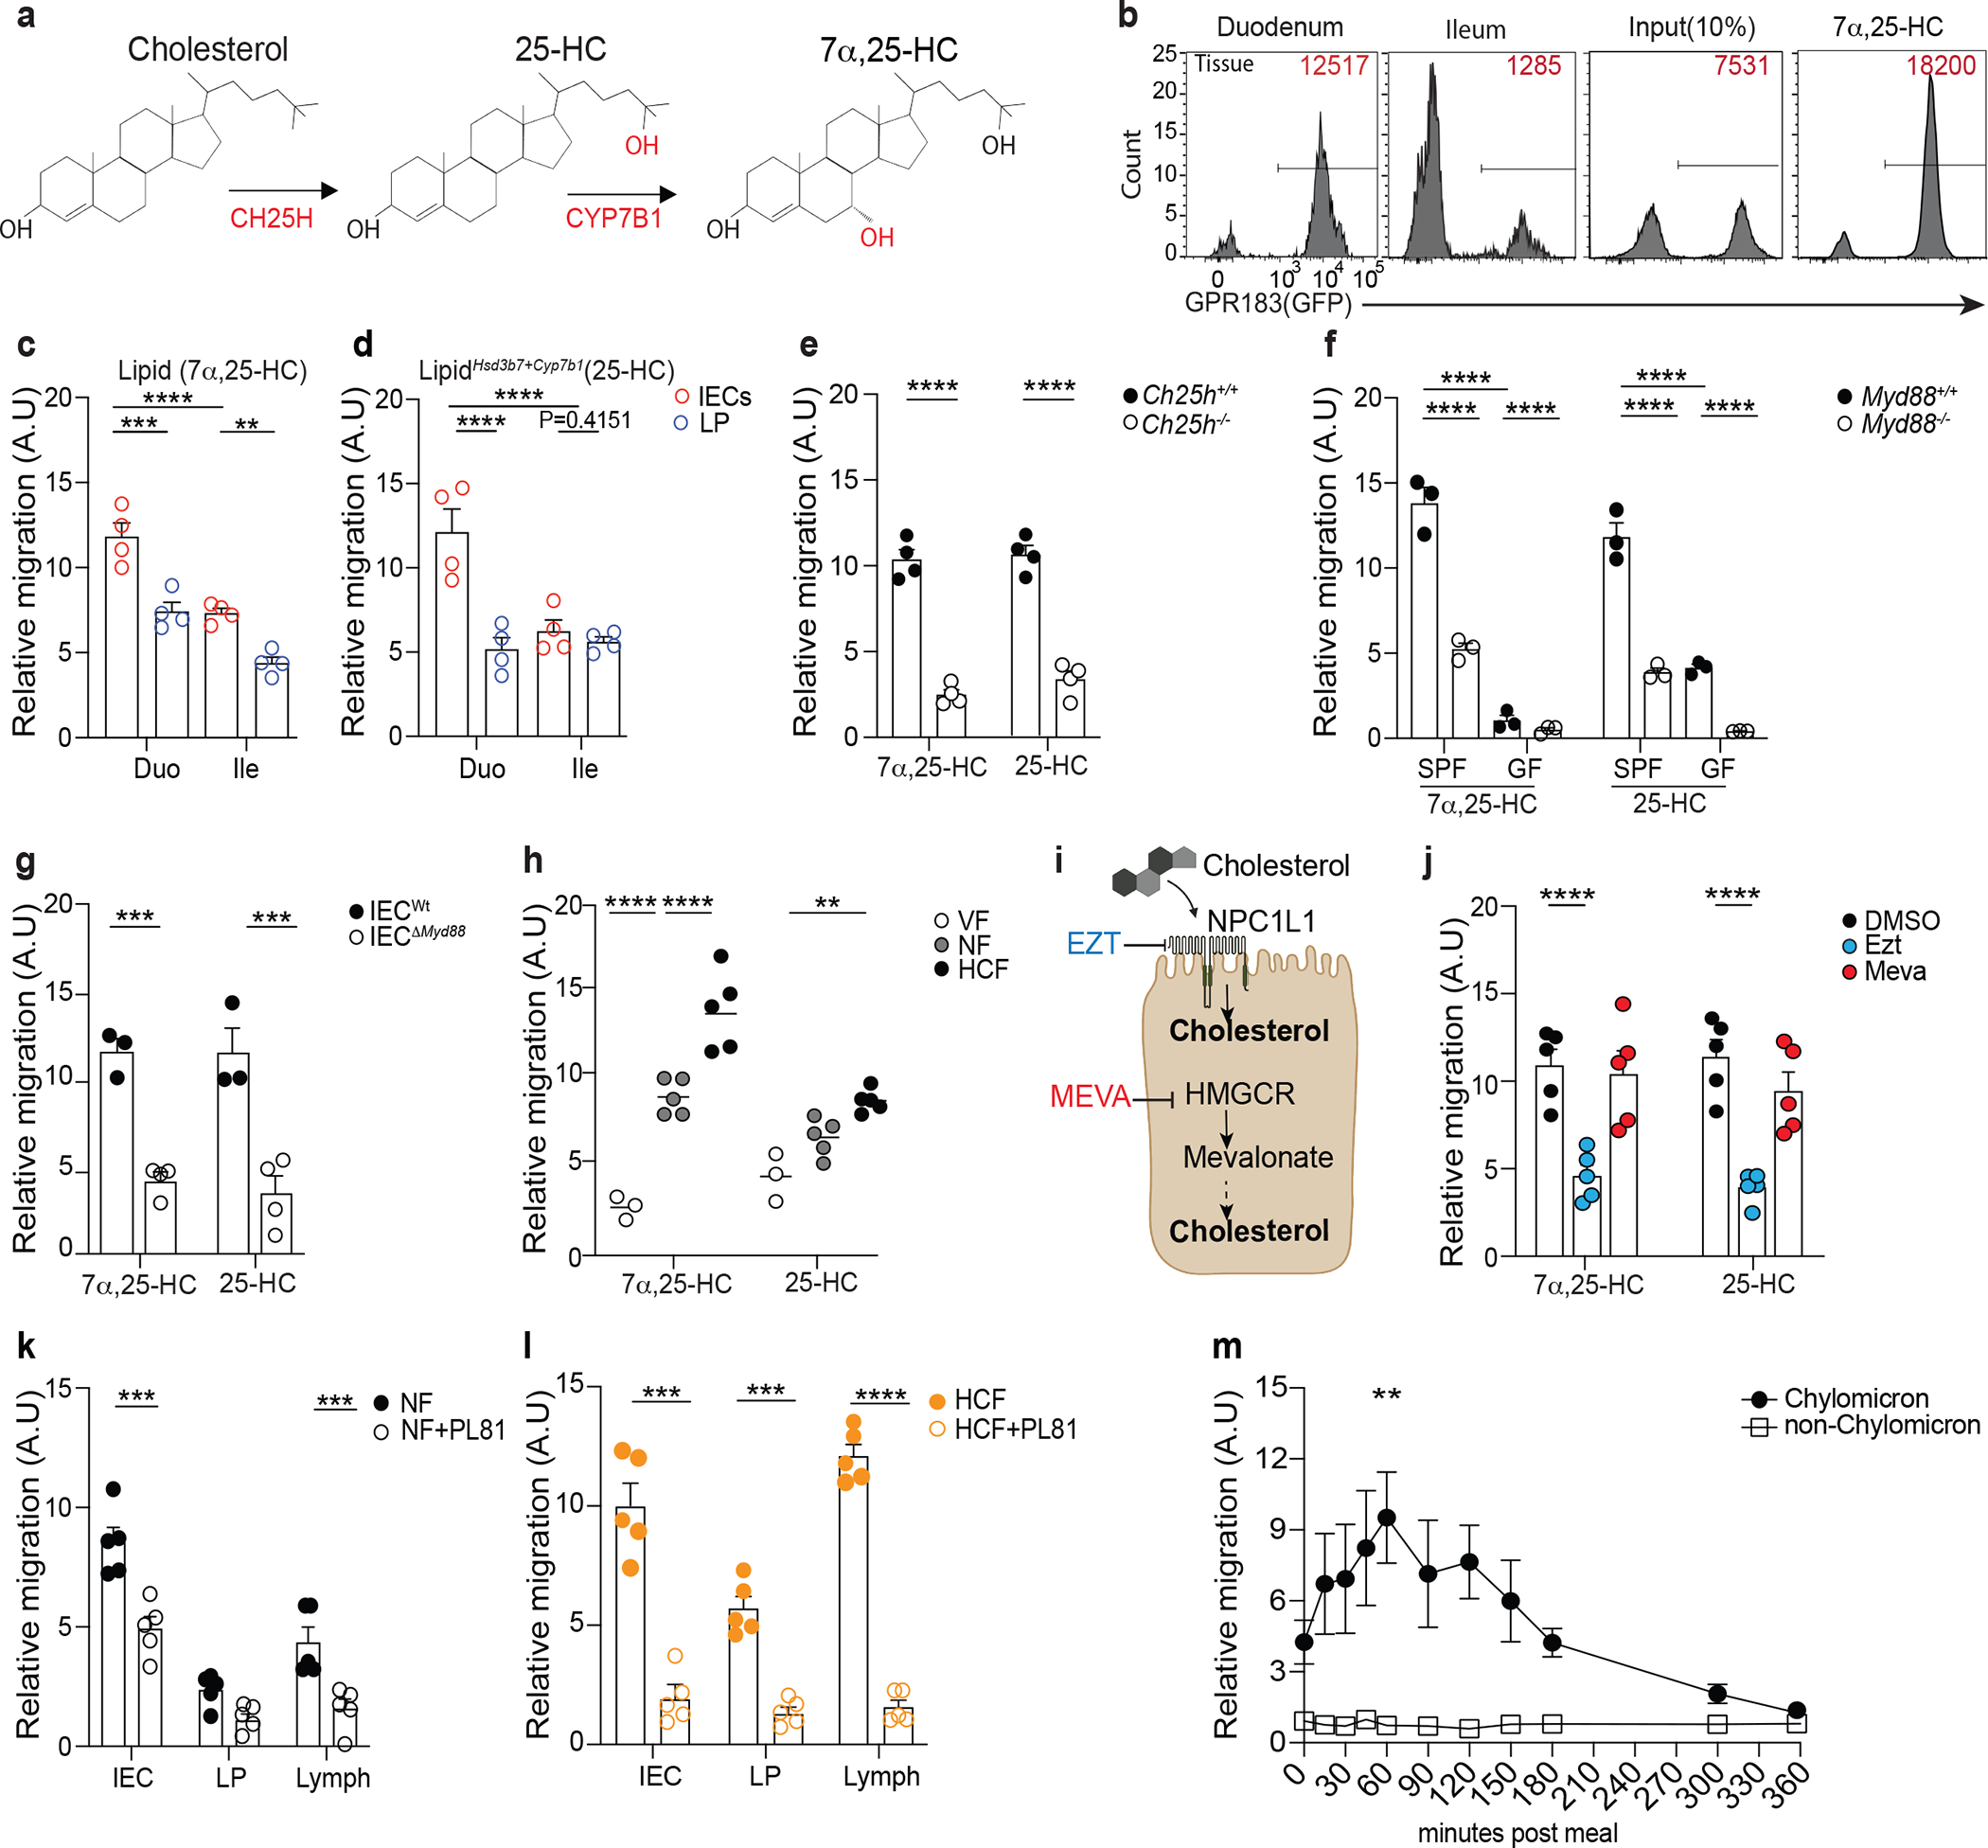
Figure 1: Intestinal epithelial cells integrate microbial and dietary cues to produce oxysterols for chylomicrons packaging and lymphatic secretion.

a, 7α,25-HC biosynthetic pathway from cholesterol. b, Representative flow cytometry plot and number of GPR183+ M12 cells migrating upon exposure to lipids extracts from duodenum and ileum tissue. The relative migration (A.U) was measured and plotted as ratio between number of migrating GFP+ M12 cells and number of migrating GFP- M12 cells and normalized to migration toward lipid free migration media (Nil). 100nM of 7α,25-HC was used as positive control for the migration assay. c,d, Summary data of 7α,25-HC (Lipid) and 25-HC (LipidHsd3b7+Cyp7b1) quantification in IECs and lamina propria (LP) of duodenum and ileum from C57Bl/6 mice (d). e, M12 migration assay of IEC lipids from Ch25h−/− and LMC mice. f, M12 migration assay of IEC lipids from germ free (GF) and specific pathogen free (SPF) MyD88−/− mice and littermate controls. g, M12 migration assay with lipids from IECs of VillincreMyD88fl/fl and LTC mice. h, Relative quantification of 7α,25-HC and 25-HC in IECs from wild type mice fed for 24 hours with normal food (NF), food with 2% of cholesterol (HCF) and vegetarian food (VF). i, Schematic representation of the pharmacological activity of Ezetimibe (Ezt) and Mevastatin (Meva) in IECs (Created with Biorender.com). j, M12 migration assay with lipids from IECs of mice treated for 24hrs with 10mg/kg (body weight) of Ezetimibe (Ezt), 20 mg/kg (body weight) of Mevastatin (Meva) or vehicle (DMSO). k, M12 migration assay with 7α,25-HC from IECs, lamina propria (LP) and Lymph of mice treated with 3% of Pluronic81(PL81) in NF condition or (l) HCF (vol/vol). m, M12 migration assay with human plasma from healthy patients upon exposure to lipid-based meal. Plasma was separated into chylomicron and non-chylomicron fractions and analyzed at the indicated time point. The results were pooled from three experiments (c,d,e,f and g)(n=3–4 mice per group); (h,j,k and l)(n=5 mice per group) and two independent experiments (m)(n=3 biologically independent samples). Statistics were measured by two-way ANOVA with Bonferroni’s correction (*p<0.05, **p<0.01,***p<0.001, ****p<0.0001) in (c,d,f,h and m) and two-sided unpaired Student’s t-test (e,g,j,k and l). Exact P values and adjustments are provided in Source data. The error bars represent the mean ± s.e.m.
