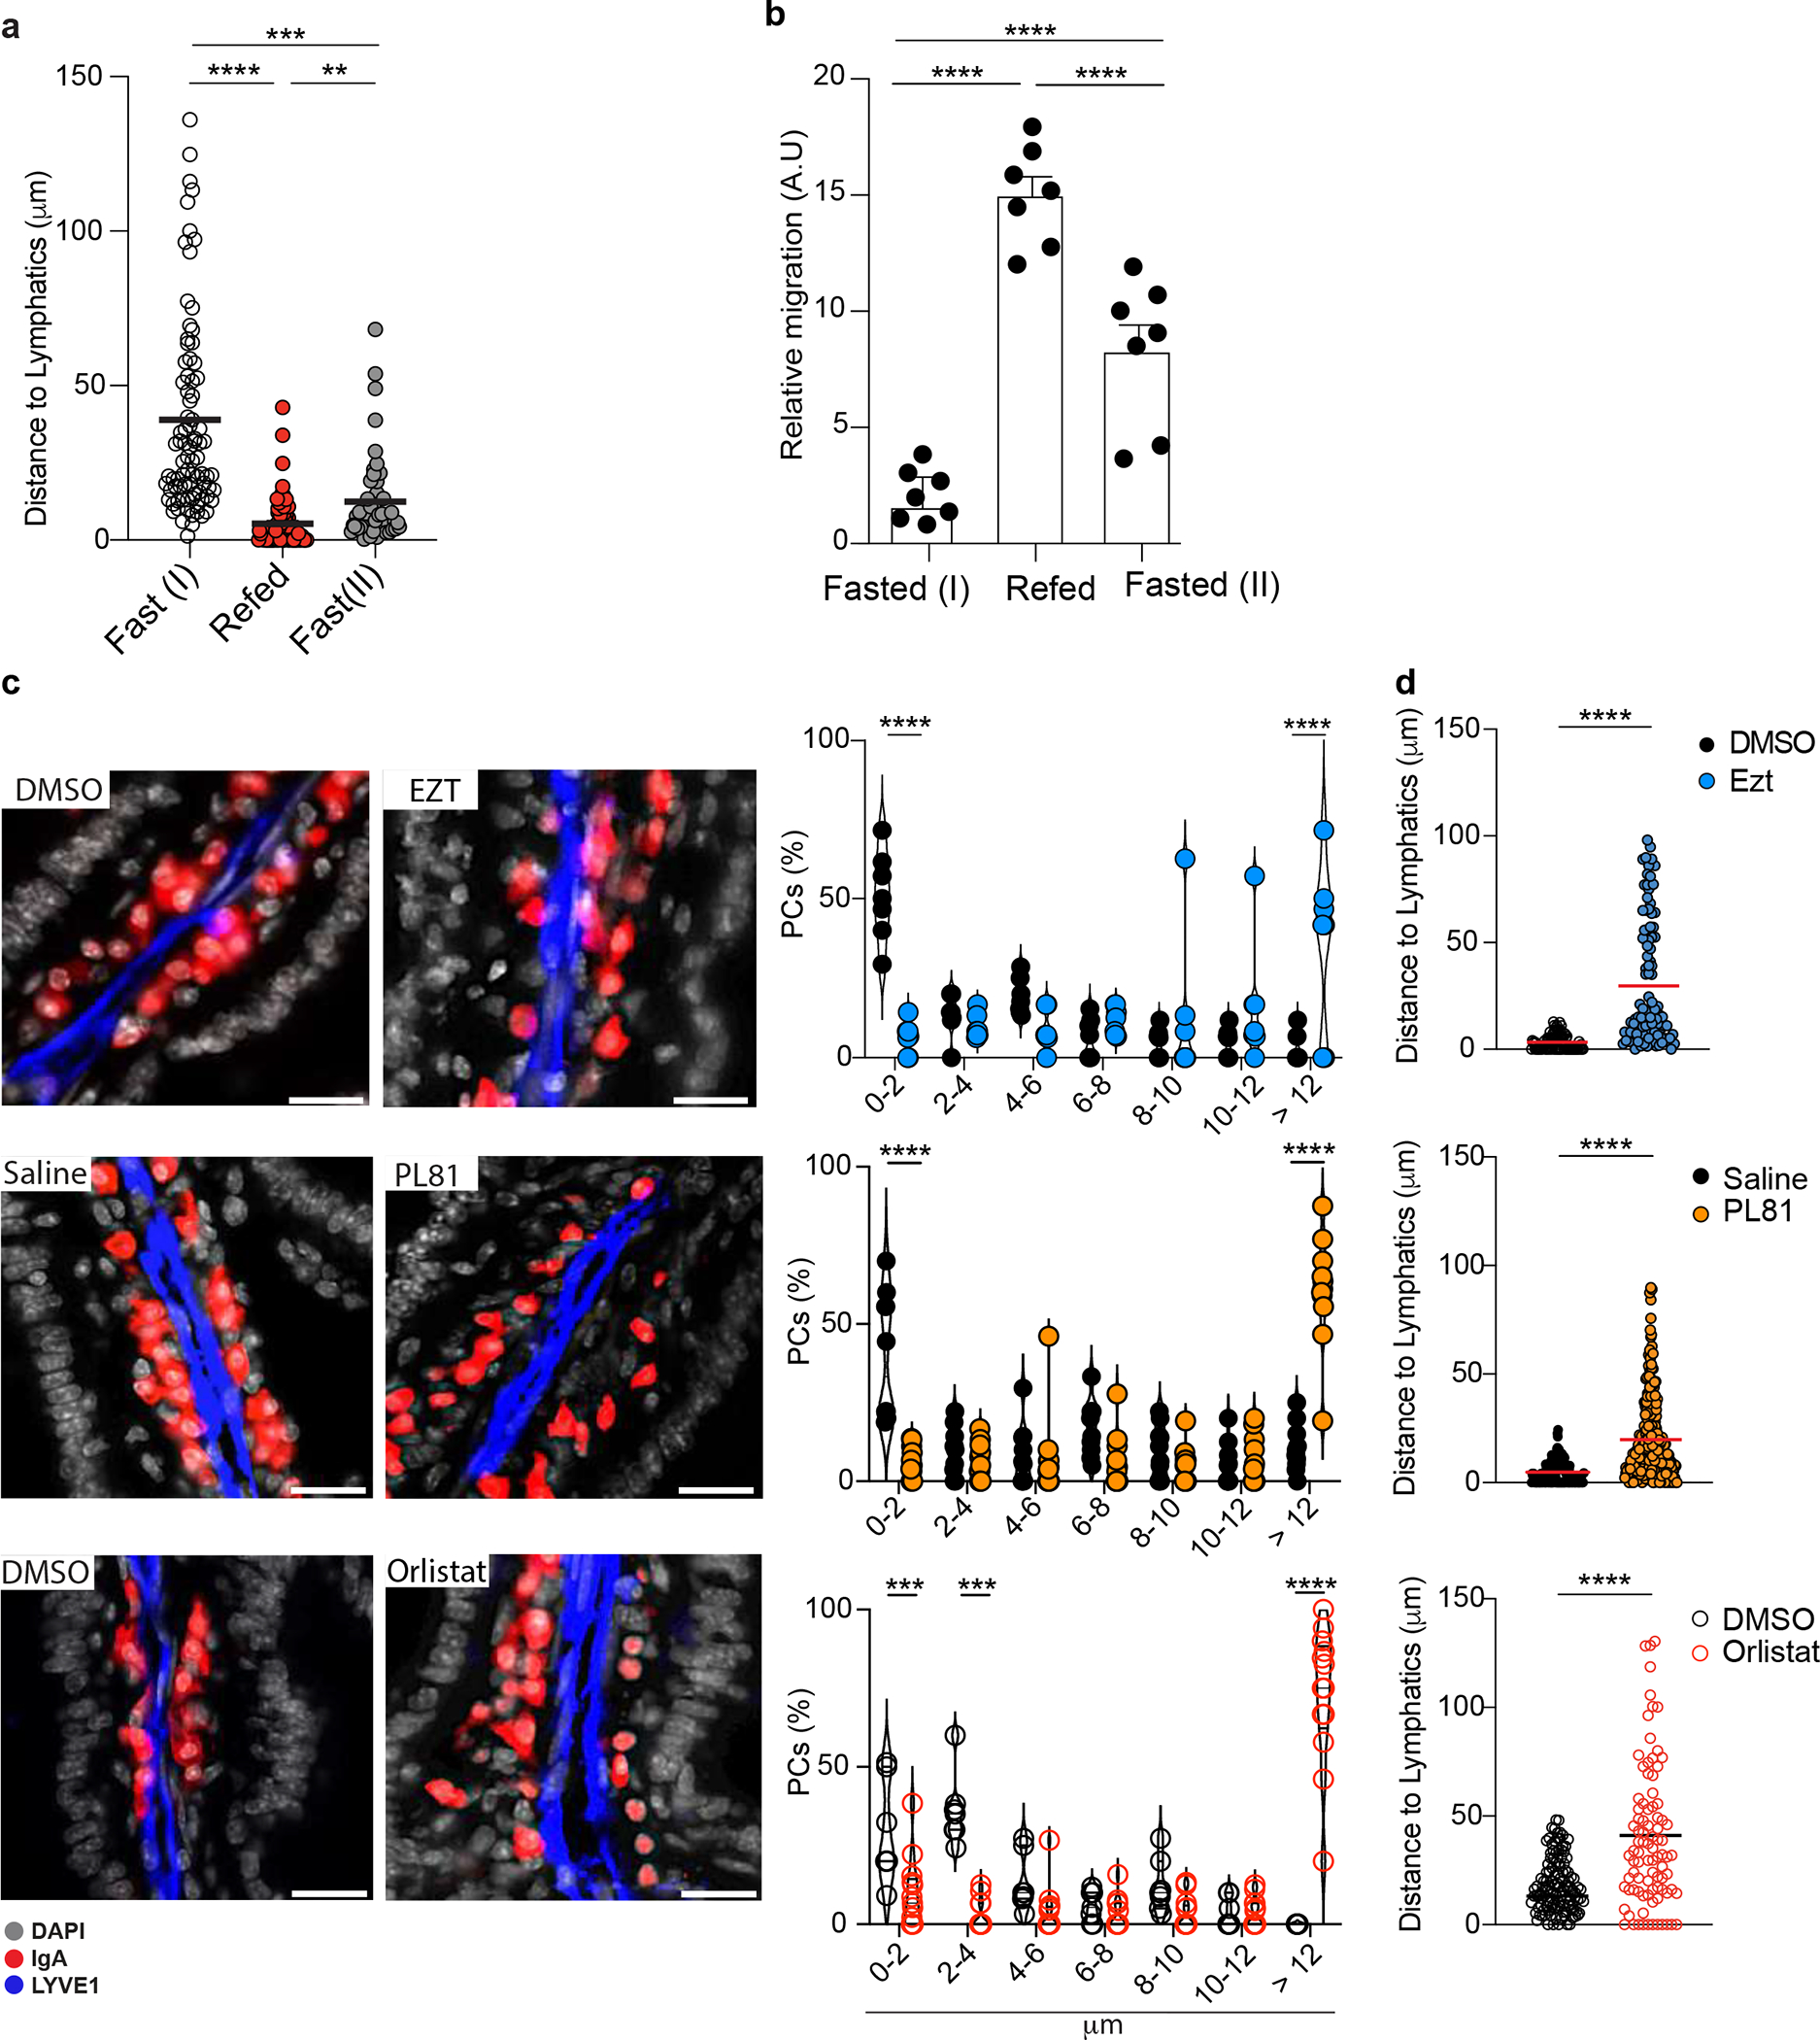
Extended data Fig. 9: Modulation of intestinal oxysterol concentration shapes intestinal plasma cell positioning.

a, Quantification of PC distance from lymphatics in mice treated with the indicated food changes. Each dot represents a single PC. b, M12 migration assay with lipid extracts from IECs of mice fasted for 12hrs, refed once with HCF and harvested after 3 or 12 hrs. c, Representative immunofluorescence and frequency of IgA+ PCs at certain distance to lymphatics in duodenum of mice treated with 3% of Pluronic81 (PL81)(vol/vol), 10mg/kg (body weight) of Ezetimibe (Ezt), 50mg/kg (body weight) of Orlistat or vehicle (saline or DMSO). Each dot represents the average of PCs distance measured in a total of n=7 mice per each treatment or (d) single PCs. Scale bar is 50 μm. The results are pooled from three independent experiments (a)(n=49–85 cells per group); (b)(n=7 mice per group); (c and d)(n=7–11 mice per group). Statistics were measured by two-way ANOVA Bonferroni’s correction (*p<0.05, **p<0.01, ***p<0.001, ****p<0.0001) in (a and b) or two-sided unpaired Student’s t-test (**p<0.01, ***p<0.001) in (c and d). Exact P values and adjustments are provided in Source data. The error bars represent the mean ± s.e.m.
