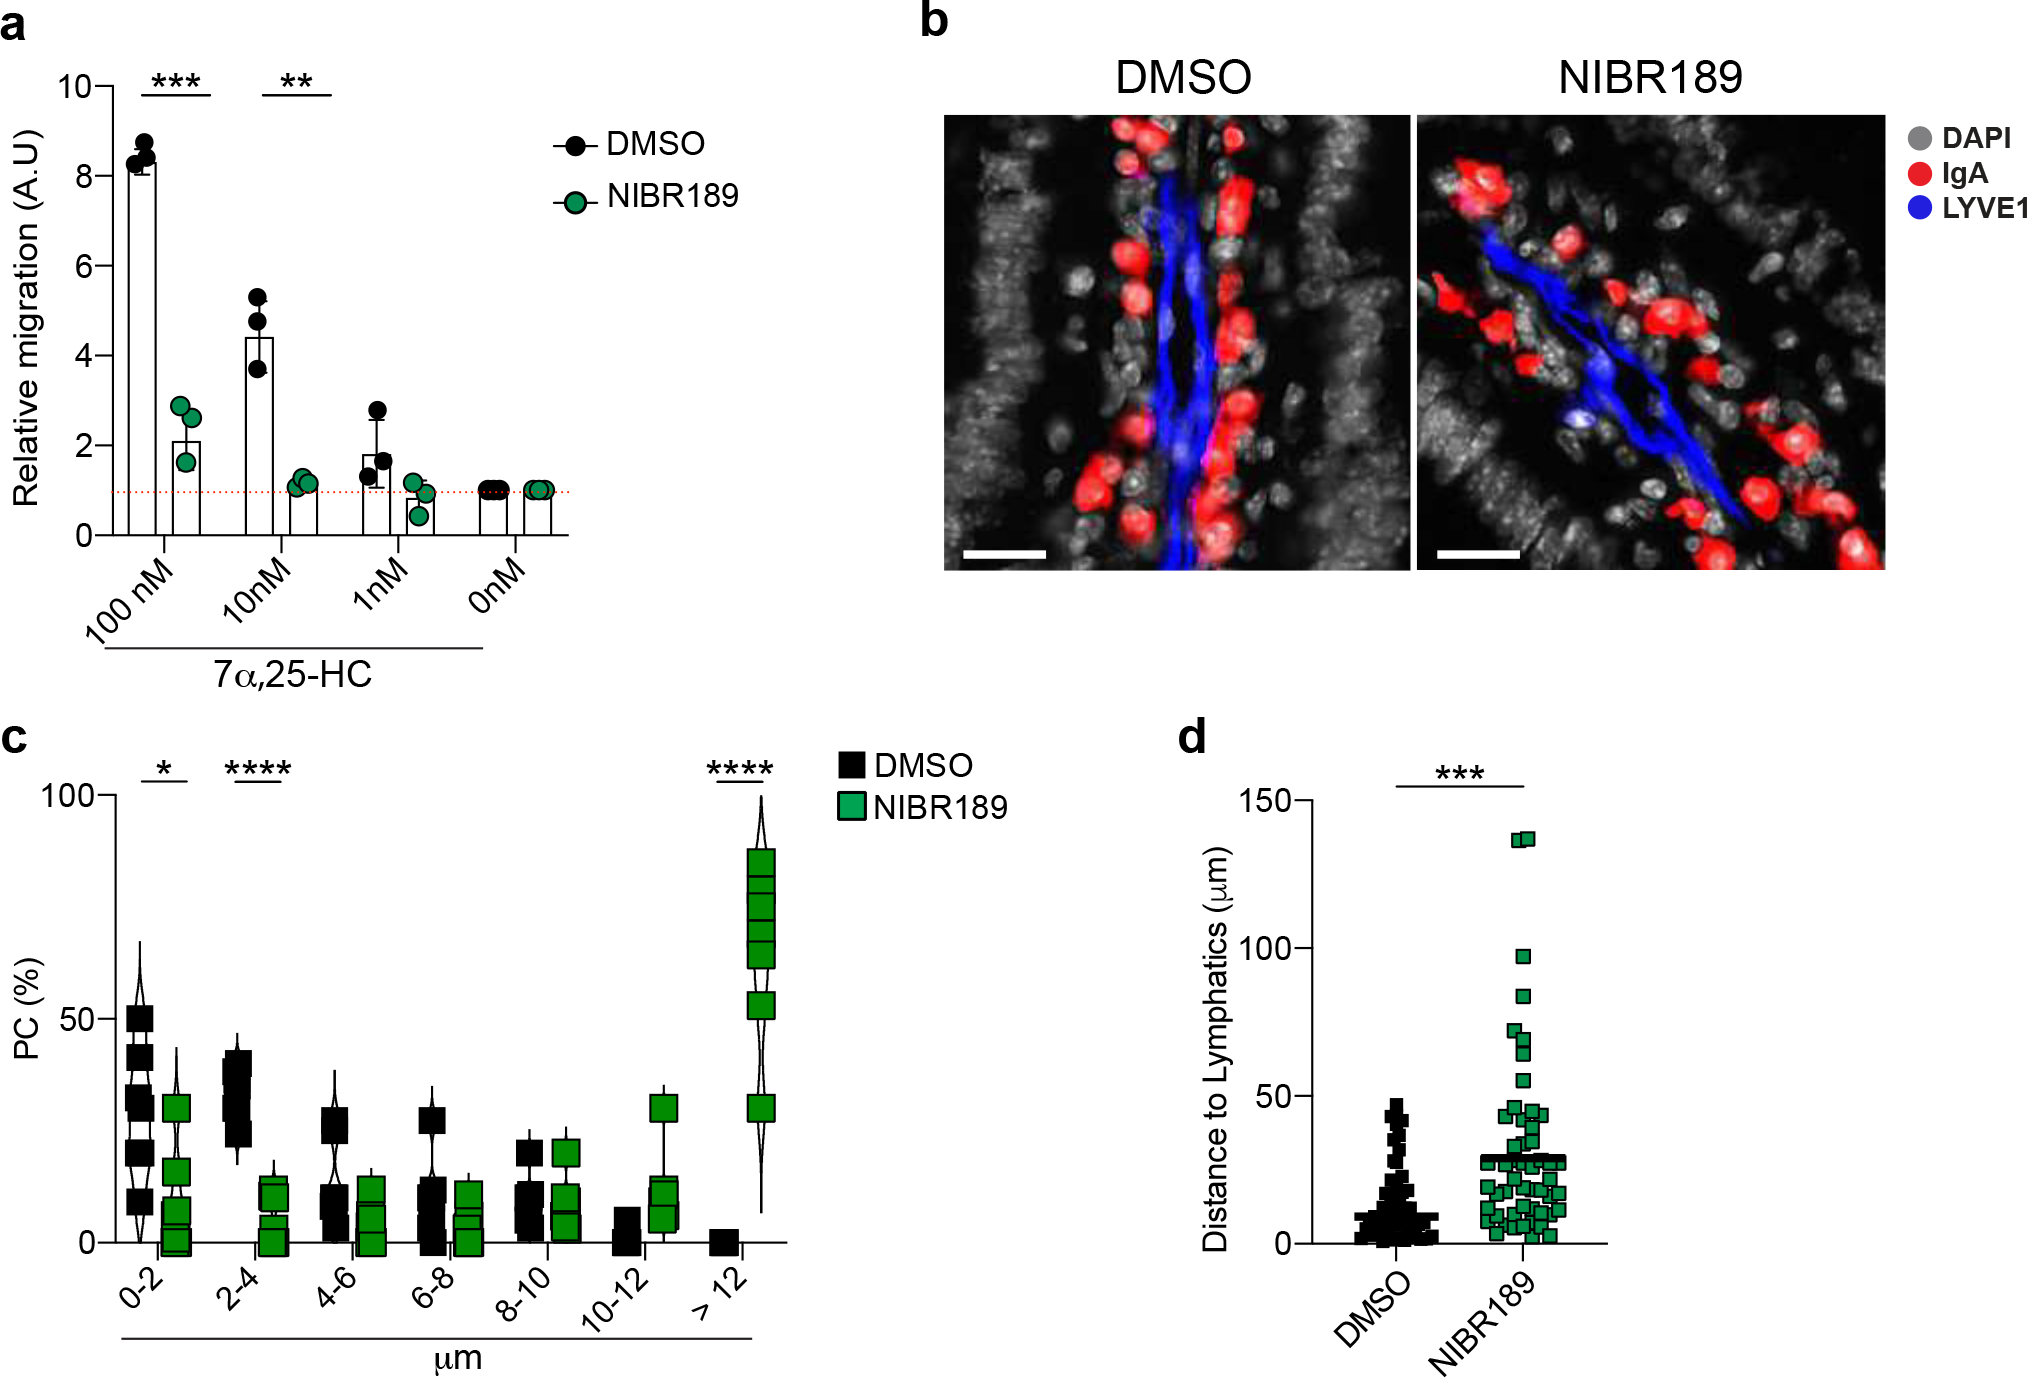
Extended data Fig. 10: GPR183 pharmacological inhibition shapes plasma cell dynamics and antigen-specific response.

a, Relative migration of lamina propria PCs from NIBR189 or vehicle (DMSO) treated mice and with the indicated concentration of GPR183L. b, Representative immunofluorescence of duodenum sections from mice treated twice with GPR183 inhibitor, NIBR189, or vehicle (DMSO).Scale bar is 50μm. c, Quantification of IgA+PCs frequency at certain distance from lymphatics (LYVE1+) showed as violin plot. Each dot represents the average of PCs frequency at the indicated range of n=7 mice per each treatment. d, Quantification of PCs distance from lymphatics upon GPR183 inhibition. Each dot represents a single PC. The results were pooled from two independent experiments (a)(n=3 mice pre group) and three independent experiments (b,c and d) (n=7 mice per group or n=62 cells (d)). Statistics were measured as two-sided unpaired Student’s t-test (***p<0.001,****p<0.0001) in (a,c and d). Exact P values and adjustments are provided in Source data. The error bars represent the mean ± s.e.m.
