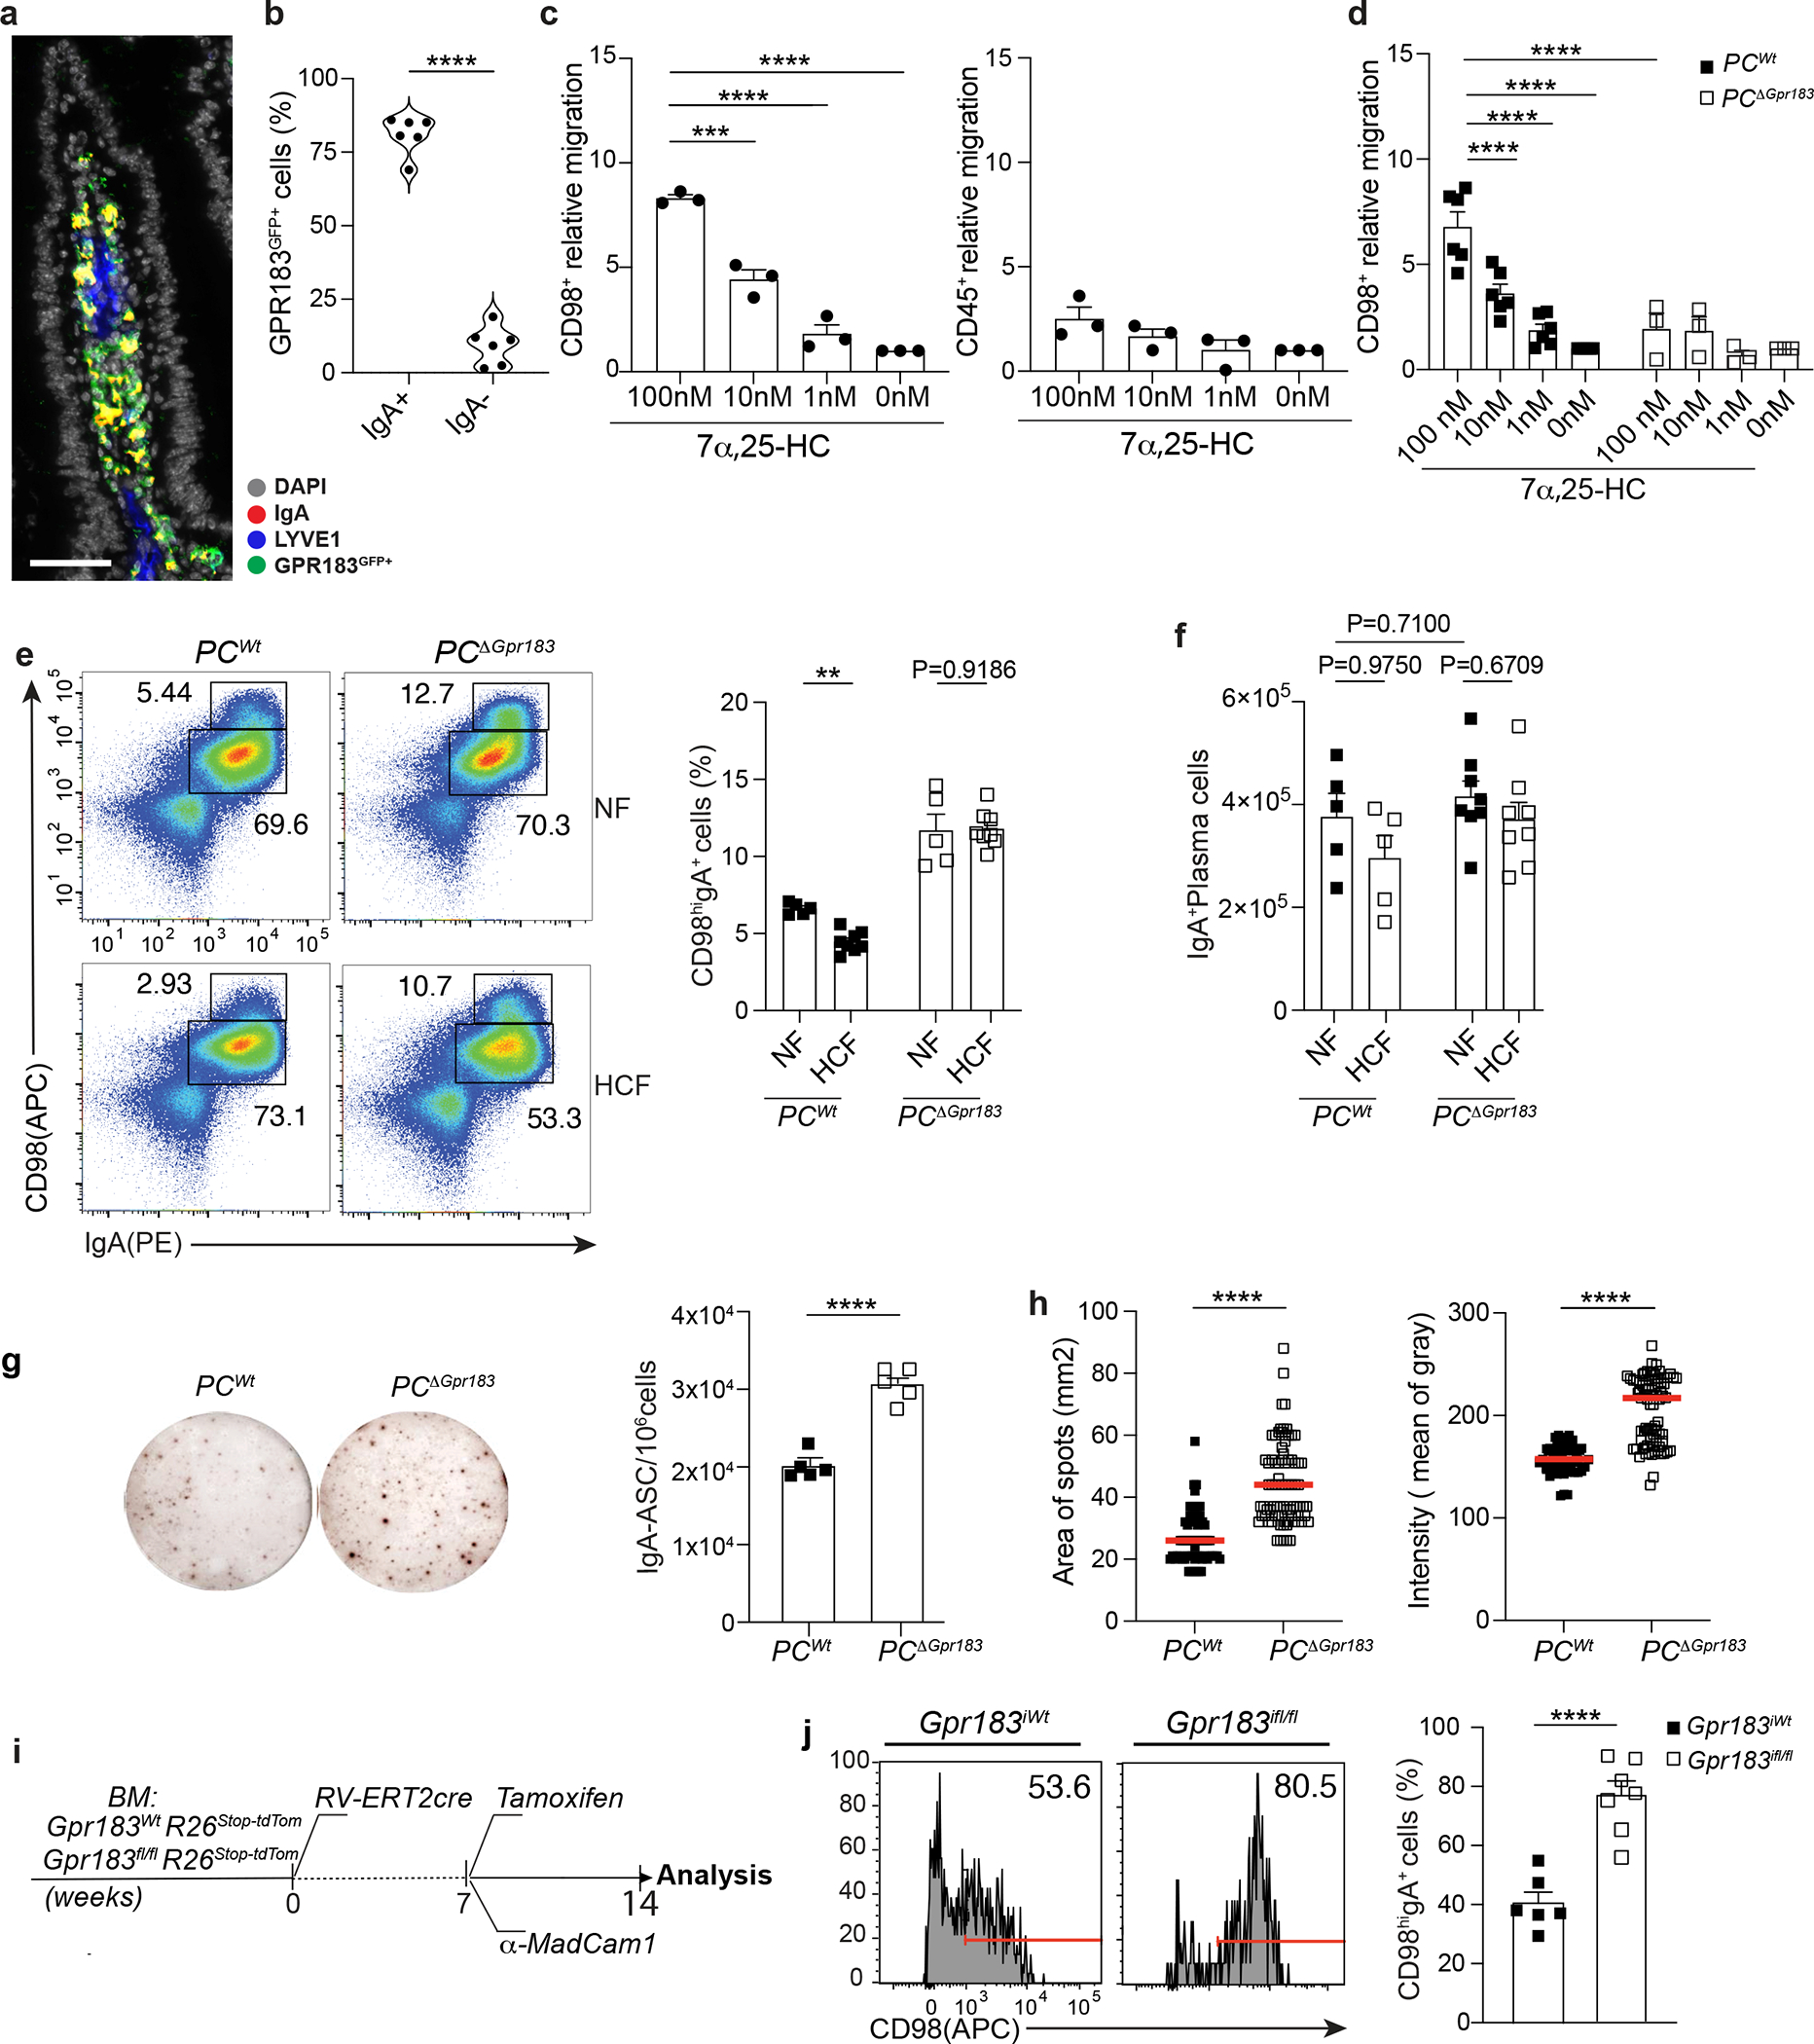
Figure 5: Intestinal plasma cells express GPR183 and migrate in response to 7α,25-HC.

a, Immunofluorescence of IgA, GPR183, LYVE1 and DAPI on duodenum sections from a Gpr183GFP/+ reporter mouse. Scale bar is 100μm. b, Frequency of GPR183 in lamina propria of Gpr183GFP/+ reporter mouse measured by flow cytometry. c, Relative migration of lamina propria plasma cell and CD45+ in response to different concentrations of 7α,25-HC. d, Relative migration of lamina propria PCΔGpr183 and wild type at the indicated concentration of GPR183 ligand. Number of migrated cells were analyzed by flow cytometry and the relative migration was measured as fold of changes. e, Representative flow cytometry plot and percentage of IgA secreting PCs (CD98hiIgA+) in PCΔGpr183 and control mice, fed for one week with NF or HCF. f, Number of total IgA+ PC in duodenum of mice from (e). g, Representative IgA ELISPOT and compiled quantification of secreting IgA+ PCs from PCΔGpr183 and controls mice at steady state. h, Area and intensity quantification of IgA+ spots from (g). Each dot represents single IgA+spot. i, Experimental model illustrating the development of Tamoxifen inducible bone marrow (BM) retroviral chimera mice. BM cells from Rosa26-STOP-tdtomato Gpr183fl/fl and Rosa26-STOP-tdtomato Gpr183Wt were transduced with retroviral vector encoding for ERT2-cre. BM cells (10X106) were injected in irradiated C57/BL6 mice. j, 8 weeks after BM reconstitution mice were injected with Tamoxifen and 100μg of anti-MadCam1 for one week and euthanized for flow cytometry analysis of IgA+ PCs. CD98 PCs were previously gated on tdTomato+ cells. The results were pooled from three independent experiments (a and b)( n=6 mice); (c)(total of n=3 mice ); (d)(n=6mice for PCWt and n=3 mice for PCΔGpr183); (e)(n=5 mice for NF fed mice n=8 for HCF fed mice); (g)(n=5 mice per group); (h)(n=64–79 cells per group) and (j)(n=6 mice per group). Statistics were calculated with one-way ANOVA in (c,d)(****p<0.0001), two-way ANOVA in (f) and two-sided unpaired Student’s t-test (**p<0.01, ****p<0.0001) in (b,e,g,h and j) with Bonferroni correction. Exact P values and adjustments are provided in Source data. The error bars represent the mean ± s.e.m.
