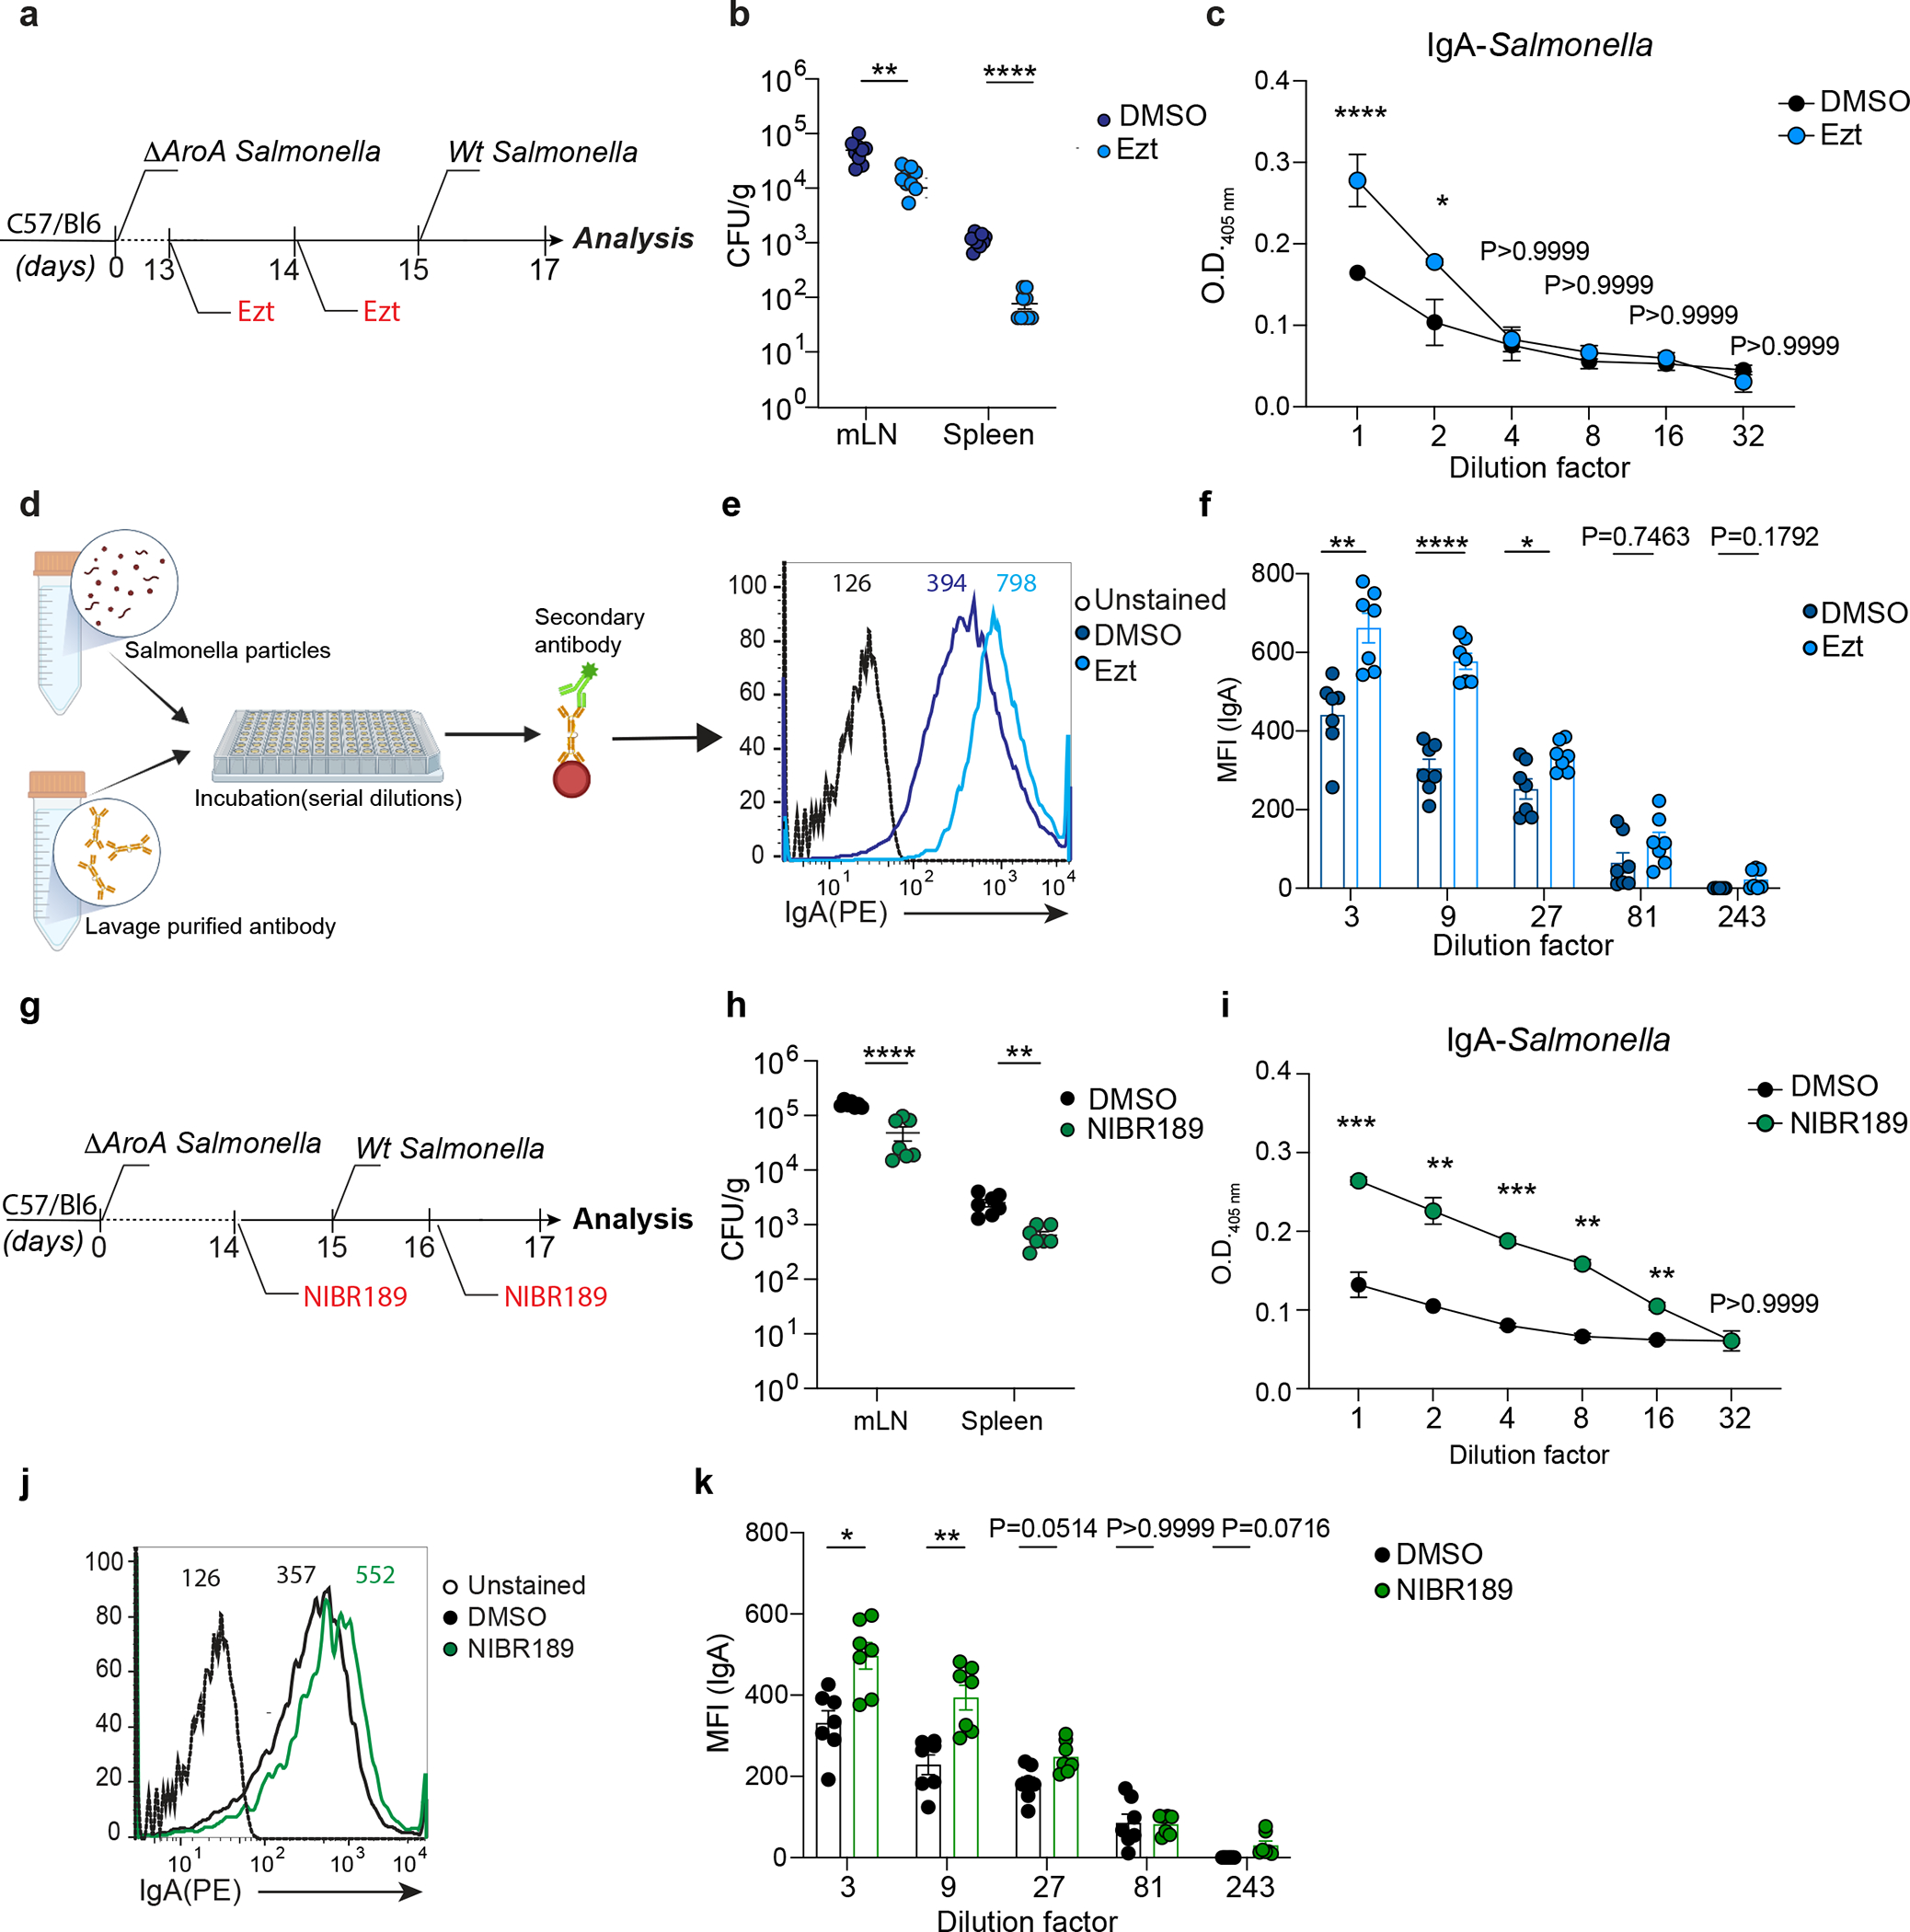
Figure 7: Cholesterol uptake and GPR183 inhibition enhance Salmonella-specific intestinal IgA response.

a, Experimental model illustrating the infection with ΔAroA Salmonella and after 2 weeks with Wt-Salmonella upon inhibition of cholesterol uptake by Ezt. b, Salmonella CFU quantification in the indicated organs from mice initially infected with non-invasive ΔAroA Salmonella, treated with Ezt or vehicle (DMSO) and challenge with a lethal dose of invasive Wt-Salmonella. c, ELISA for Salmonella-specific IgA quantification in intestinal lavages of mice treated with Ezt and infected with Salmonella (n=7). d, Diagrammatic representation of how a basic bacterial flow cytometry experiment is carried out with antibodies purified from intestinal lavages of mice orally infected with Salmonella. e, Representative flow cytometry (dilution 1:3) and compiled quantification (f) of Salmonella-specific binding IgA (MFI) in intestinal lavage of mice infected as in (a). g, Experimental model illustrating the infection with ΔAroA Salmonella and after 2 weeks with Wt-Salmonella in mice pretreated with the GPR183 agonist inverse, NIBR189 (Created with Biorender.com). h, CFU measurement of Salmonella in the indicated tissues harvested from mice infected as indicated in (g). i, ELISA of Salmonella-specific IgA in intestinal lavages of mice treated as in (g). j, Representative flow cytometry of Salmonella-specific binding IgA in intestinal lavages (dilution 1:3) of mice infected first with ΔAroA Salmonella and then with Wt-Salmonella upon NIBR189 treatment and compiled quantification of IgA (MFI)(k). The results were pooled from three independent experiments (b,f,h and k)(n=7 mice per group); (c)(n=4 mice per group); (i)( n=3 mice per group). Statistics were measured as two-sided unpaired Student’s t-test (*p<0.05,**p<0.01,***p<0.001,****p<0.0001)in (b,c,f,h,i and k). Exact P values and adjustments are provided in Source data. The error bars represent the mean ± s.e.m.
