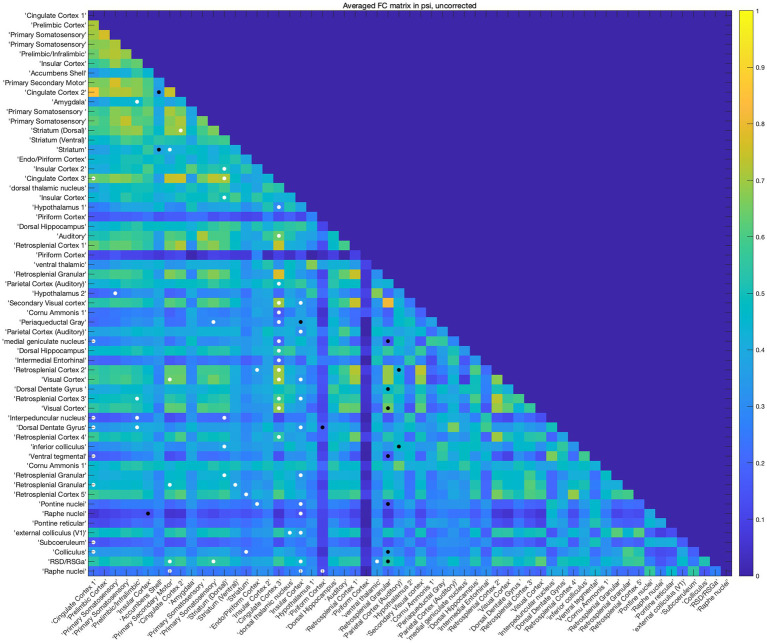
Figure 2.
Psilocybin changed brain functional connectivity. The rat brain was divided into 59 ROIs, FC between each ROI was analyzed using paired-sample t test without multiple correction, a threshold of p < 0.05 was used for the statistical analysis. White dots indicate increased FC between the two ROIs and black dots indicate decreased FC between them. Among the matrix, the FC of Cg (Cg1,3) and striatum changed most.

