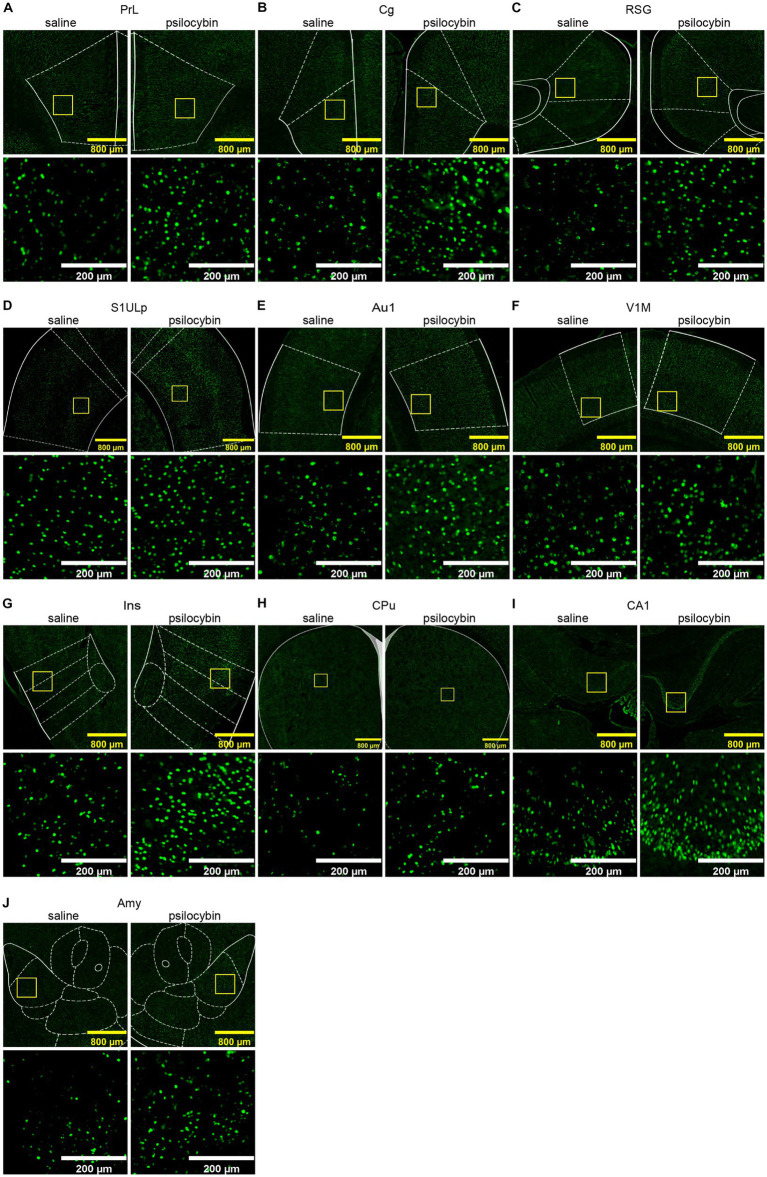
Figure 4.
Representative immunofluorescence images of increased EGR1 in different regions. (A) prelimbic region, PrL, (B) cingulate cortex, Cg, (C) retrosplenial granular cortex, RSG, (D) primary somatosensory cortex, upper lip, S1ULp, (E) primary auditory cortex, Au1, (F) primary visual cortex, monocular, V1M, (G) insular cortex, Ins, (H) caudate putamen (striatum), CPu, (I) filed CA1 of the hippocampus, CA1, (J) amygdala, Amy. Scale bars, 800 μm in yellow, 200 μm in white.

