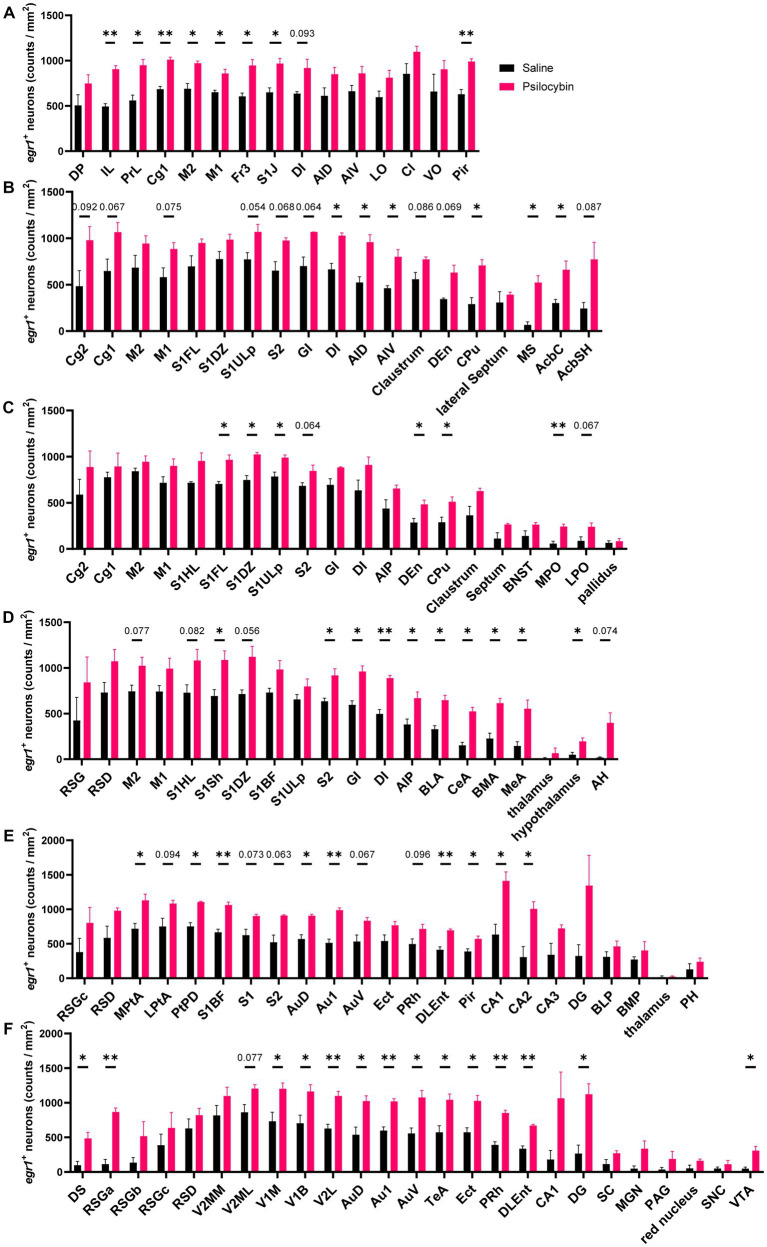
Figure 5.
Increased EGR1 expression after psilocybin. Density of EGR1 positive neurons in different coronal sections (AP): (A) + 3.24 mm, (B) + 0.96 mm, (C) −0.24 mm, (D) −2.04 mm, (E) −3.84 mm, (F) −5.88 mm. The abbreviations of the IF brain regions were listed in Supplementary Table S2. Data are shown as mean ± SEM, multiple unpaired t test, compared with saline group, * p < 0.05, ** p < 0.01, p value ranging between 0.05 and 0.1 are directly annotated in the graphs, n = 3 per group.

