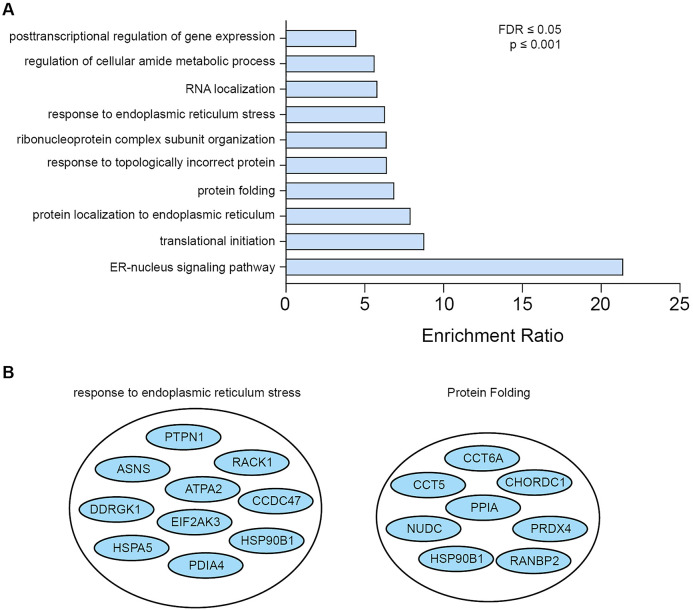
Figure 1.
(A) Gene ontology analysis of the protein hits discovered using PERK-BirA* obtained using WEB-based GEne SeT AnaLysis toolkit (http://www.webgestalt.org/). The minimum number of IDs in each category was required to be 5, the maximum was 2000, the false-discovery rate (FDR) correction used was Benjamini and Hochberg (BH). The categories were first ranked based on FDR and after that the topmost significant categories were selected. 10 categories of biological processes were identified, many related to the function of PERK. The enrichment ratio indicates the ratio between the fraction of proteins belonging to each biological process in our dataset over the fraction of these proteins expected If our dataset was completely random. (B) Two specific categories are highlighted, response to endoplasmic reticulum stress, and protein folding, indicating an enrichment in the dataset of proteins and processes linked to PERK's role in the unfolded protein response and ER stress.

