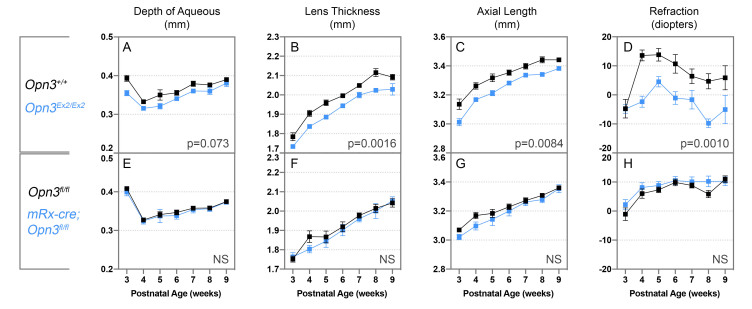
Figure 3.
Opn3 null mice myopic ocular biometry for mice of the Opn3Ex2/Ex2 (top row) and Opn3fl/fl; mRx-cre genotypes (bottom row), including depth of the aqueous compartment (A, E), lens thickness (B, F), axial length (C, G), and refraction (D, H). In Opn3Ex2/Ex2 mice (n=5), the depth of the aqueous is shallower (A, blue trace), the lens is thinner (B, blue trace), and the axial length is shorter (C, blue trace) than in the control Opn3+/+ cohort (A–C, black traces, n=4). In addition, Opn3Ex2/Ex2 mice exhibit significantly reduced refraction (D, blue trace) compared with the control Opn3+/+ cohort (D, black trace). In contrast, no significant changes were observed in these parameters in mice of the Opn3fl/fl; mRx-cre genotype (E–H, blue traces, n=10) when compared with the Opn3fl/fl control cohort (E–H, black traces, n=11). Statistical significance was assessed using a two-way ANOVA. The p-values in the charts refer to main effect of genotype comparisons. NS: Not significant.

