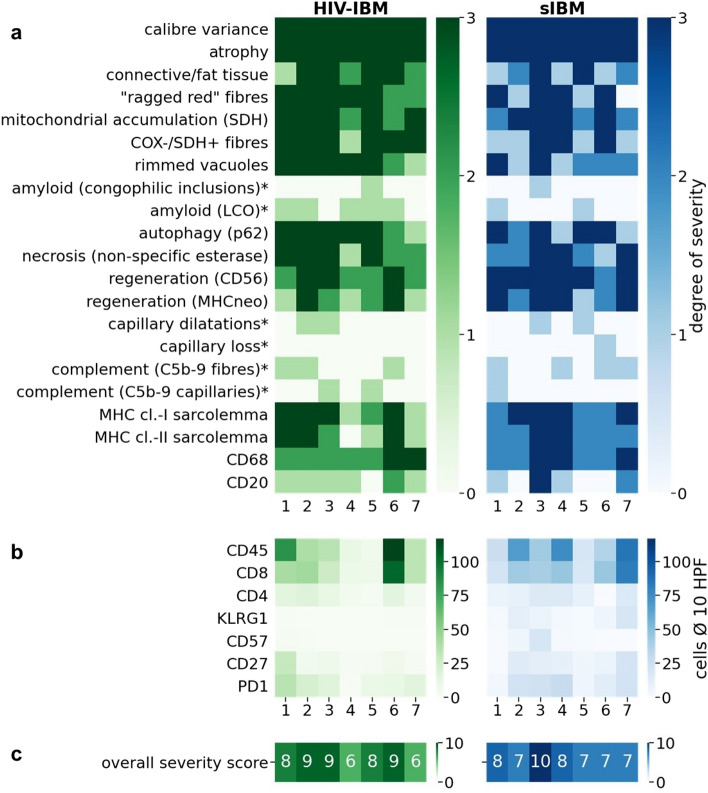
Fig. 1.
Heatmap: histomorphological features of patients with HIV-IBM (green) and sIBM (blue). In the upper part (a) all features are divided into degrees of severity from 0 to 3 or positive/negative (0–1) if marked with a star (*). The middle part (b) shows the average cell counts per HPF for immunohistochemistry of specific T cell markers. All features are summarized in the lower part of the heatmap (c) in an overall severity score from 0 to 10. The overall severity score averaged 8 out of 10 in both groups (c)

