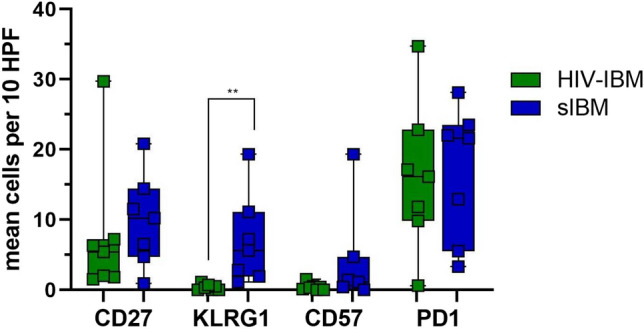
Fig. 3.

Quantitative immunohistochemistry for CD27, KLRG1, CD57 and PD1: comparison of HIV-IBM (green) and sIBM (blue). The average cell counts from ten high power fields (HPF) are shown in a boxplot. Statistical calculations were performed for the Mann–Whitney U test. The level of significance was set at 1% (**). KLRG1+ cells were undetectable in the HIV-IBM group, but showed a significantly higher expression in the sIBM group. There was no significant difference in the number of CD27-, CD57- and PD1-positive cells between patients with HIV-IBM and sIBM
