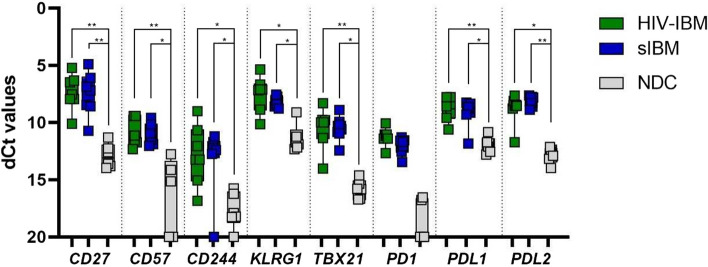
Fig. 4.
Quantitative PCR for CD27, CD57, CD244, KLRG1, TBX21, PD1, PDL1, PDL2: comparison of HIV-IBM (green), sIBM (blue) and NDC (grey). Delta CT values are shown in a boxplot on the inverse axis. Statistical calculations were performed for the Kruskal–Wallis test with Bonferroni–Dunn correction to analyze the quantitative differences of mRNA transcripts. The level of significance was set at 5% (*) and 1% (**). All markers were shown to be significantly upregulated at gene expression levels compared to the NDC group, with no significant difference between the IBM subgroups

