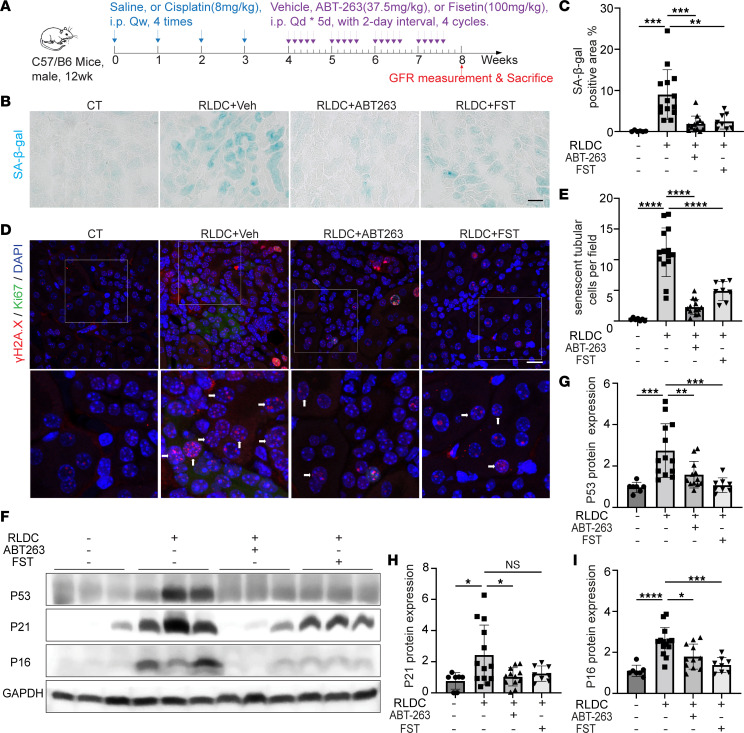
Figure 1. Persistent renal tubular senescence is induced in post-RLDC mice and suppressed by senolytic drugs ABT-263 and Fisetin.
(A) Schematic diagram of treatment. C57BL/6 mice were subjected to RLDC treatment followed by 4-week treatment of ABT-263 (n = 13), Fisetin (FST) (n = 8), or vehicle (n = 14). Control (CT) mice (n = 6 or 7) were injected with saline. Kidneys were harvested at 8 weeks for analysis. (B) Representative images of SA-β-gal staining. Scale bar: 50 μm. (C) Quantification of SA-β-gal staining. (D) Representative images of costaining of γH2A.X (red), Ki67 (green) and DAPI (blue). Arrows indicate typical senescent tubular cells with 4 or more γH2A.X-positive foci and Ki67-negative. The bottom images are enlarged from the boxed areas in the top images. Original magnification, ×630 (original); ×1,260 (enlarged). Scale bar: 15 μm. (E) Quantification of γH2A.X-positive/Ki67-negative senescent tubular cells. (F) Immunoblot analysis of P53, P21, and P16. (G–I) Densitometry of P53, P21, and P16 expression. Quantitative data are presented as mean ± SD. One-way ANOVA with multiple comparisons was used for statistics. *P < 0.05, **P < 0.01, ***P < 0.005, and ****P < 0.001.

