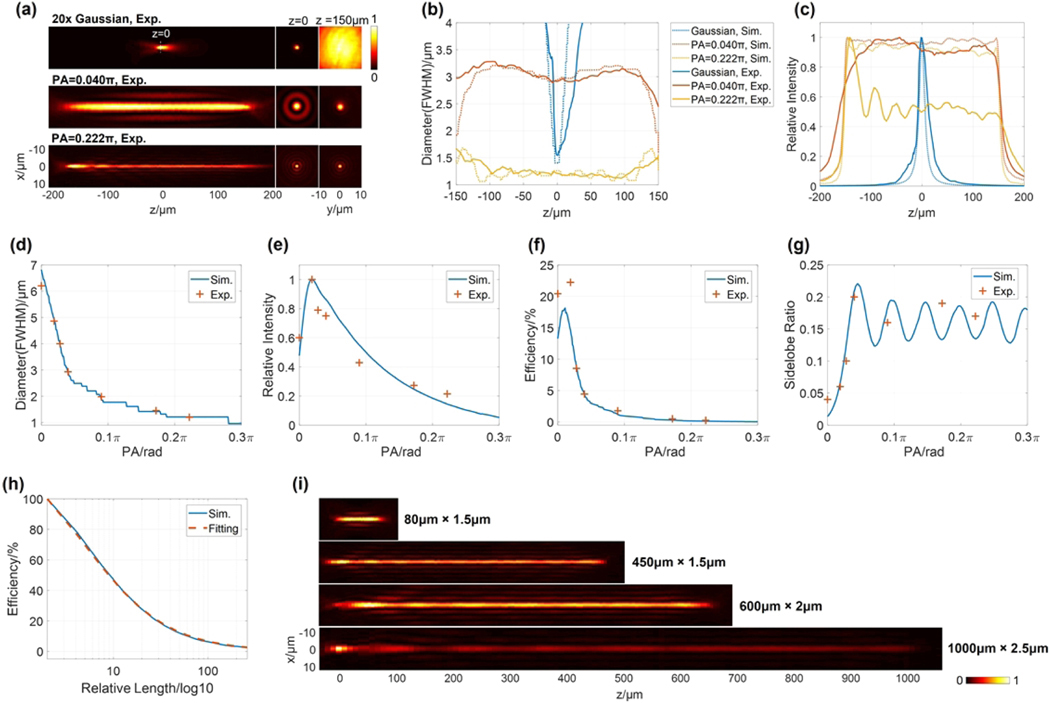
Fig. 2.
Beam profiles. (a) Profiles of the Gaussian beam (20× lens) and two 300 μm NBs with the phase adjusters of and and the focus index . (b) Experimental and simulated diameter profiles of the three beams are congruent; (c) shows their axial intensity distributions. The effects of P A on seven 300 μm NBs’ (d) beam diameter, (e) beam intensity, (f) beam efficiency, and (g) sidelobe ratio at the middle ofa NB. (h) Simulation where P A = 0, proving beam efficiency is inversely proportional to the beam length (BL). Its fitting curve is (0.145rL + 1)−1, and is the relative length. (i) Other NBs generated by the same 20× objective and incident Gaussian beam. NB, needle-shaped beam; Sim., simulated; Exp., experimental; RL, Raleigh length; FWHM, full width at half-maximum.

