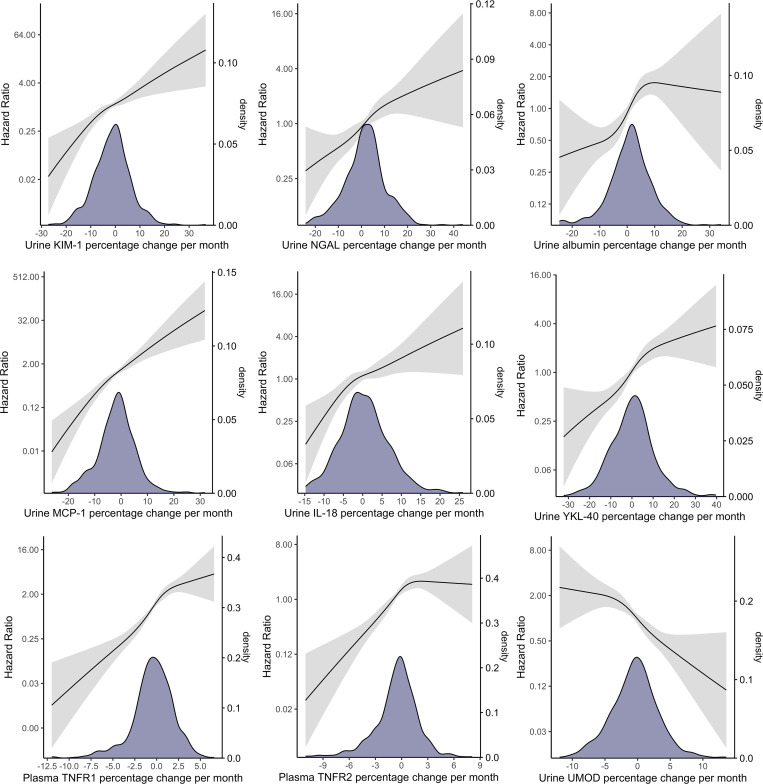
Figure 3. Distribution of monthly biomarker changes and the associations between biomarker slopes using restricted cubic splines with the composite CKD outcome in 656 participants with AKI.
Distribution of biomarker slopes were visualized using kernel density plot to aid the interpretation of the confidence in hazard ratio estimates. Cox proportional hazard regression models were adjusted for biomarker at hospitalization, age, sex, race, Hispanic ethnicity, hypertension, diabetes, atherosclerotic disease, congestive heart failure, smoking status, baseline eGFR, albuminuria at hospitalization, urine creatinine at hospitalization, and the slope of urine creatinine from hospitalization to 12 months after discharge.

