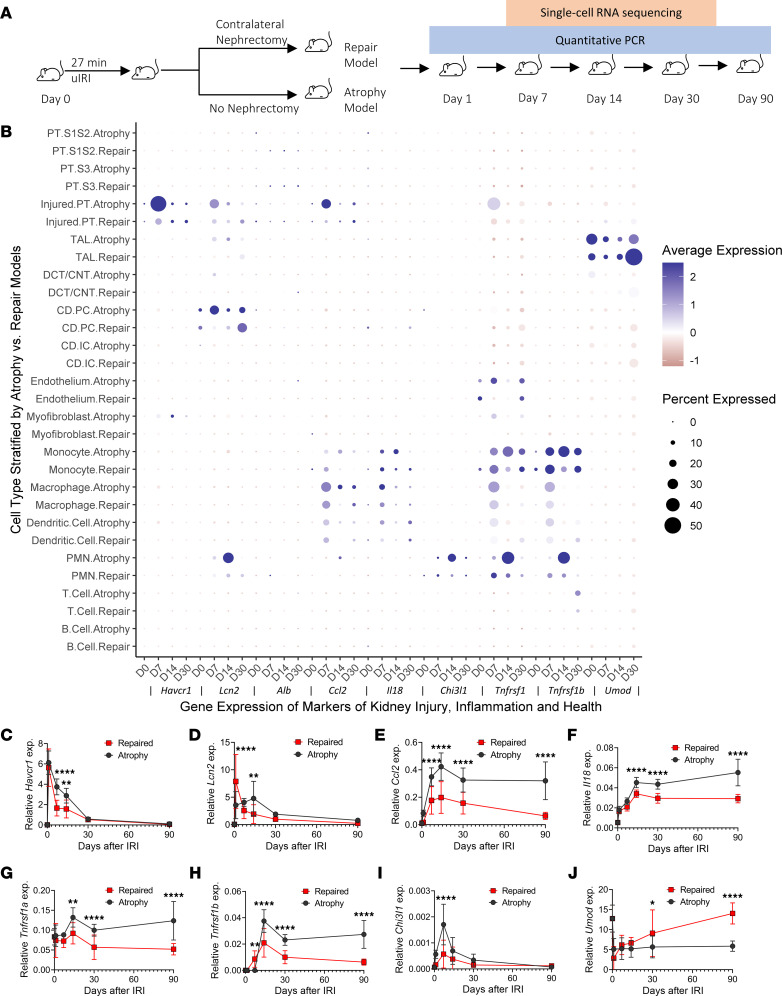
Figure 4. Comparison of the gene expressions of biomarkers of kidney injury, inflammation, and tubular health in mouse models of atrophy and repair after ischemic reperfusion injury.
(A) Overview of animal experiments. WT mice were subjected to 27 minutes of unilateral IRI with the contralateral kidney intact (atrophy model) or unilateral IRI with contralateral nephrectomy (repair model) followed by single-cell isolation and sequencing (scRNA-Seq and qPCR) at the indicated time points (14). (B) Expression of mRNA for biomarkers across 95,343 cells of the indicated identity (y axis) in mouse models of repair and atrophy at multiple time points after IRI (n = 2 kidneys for control; n = 2 kidneys/time point/model for days 7, 14, and 30). (C–J) qPCR analysis for Havcr1, Lcn2, Ccl2, Il18, Chi3l1, Tnfrsf1a, Tnfrsf1b, and Umod was performed on whole-kidney RNA harvested 0, 1, 7, 14, 30, and 90 days after injury; n = 10 kidneys/time point/model. *P < 0.05, **P < 0.01, ****P < 0.0001 at the indicated time point using 2-way ANOVA followed by Bonferroni post hoc test for subgroup analysis.

