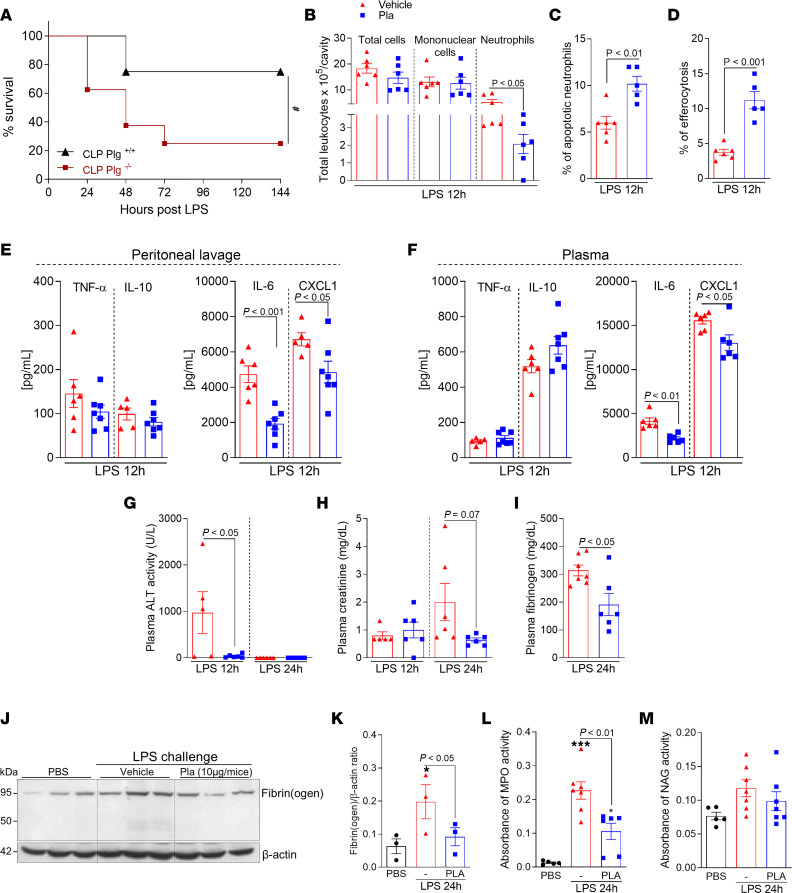
Figure 5. Effect of Plg depletion on lethality and of Pla treatment on inflammatory parameters during endotoxemia induced by LPS.
Plg+/+ and Plg–/– mice were subjected to an i.p. injection of LPS (10 mg/kg). (A) The survival rates (n = 8 mice) were monitored for 6 days. #P < 0.05 when comparing Plg+/+ and Plg–/– mice by log-rank test (survival curves). WT C57BL/6J mice were subjected to an i.p. injection of LPS (10 mg/kg) and then treated with Pla (10 μg/mouse i.p.) 3 hours later. Cells present in the peritoneal cavity were harvested 12 hours after LPS injection. (B–D) The number of total cells, mononuclear cells, and neutrophils (B), percentage of apoptotic neutrophils (C), and efferocytosis (D) were evaluated by counting cytospin slides treated with May–Grünwald–Giemsa stain. (E and F) The levels of TNF, IL-10, IL-6, and CXCL-1 were quantified in cell-free peritoneal lavages (E) and plasma (F), by ELISA. (G–I) The ALT activity (G), and creatinine (H) and fibrinogen (I) levels were measured in plasma. (J) Expression of fibrin(ogen) in the liver was determined by Western blotting (n = 3) with anti–β-actin used as loading control. (K) Densitometric analysis is also represented. (L and M) MPO (L) and NAG (M) activities were measured in the liver homogenates. Results are shown as the mean ± SEM of 5–7 mice per group. The experiments were performed 3 times with similar results. *P < 0.05, ***P < 0.001 when comparing PBS-injected mice with LPS-injected mice. P values are indicated in the graphs when comparing vehicle with Pla-treated mice by 1-way ANOVA with post hoc Newman-Keuls (multiple groups) or unpaired 2-tailed Student’s t test (when comparing 2 groups). Outliers were removed from the graphs when detected.

