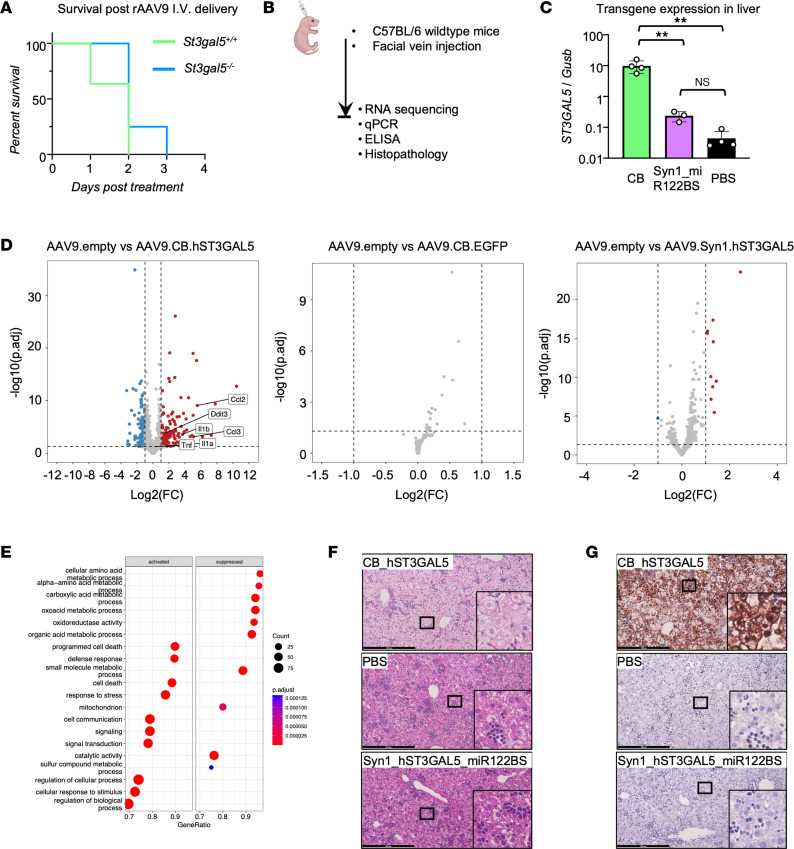
Figure 4. Liver detargeting eliminates ST3GAL5 overexpression–induced toxicity.
(A) Median survival after AAV9.CB.hST3GAL5 i.v. delivery. Data are plotted as probability of survival from 4 to 11 animals. (B) Schematic of facial-vein delivery of AAV9.CB.hST3GAL5, or AAV9. EGFP, or AAV9.empty, or AAV9.Syn1.hST3GAL5.miR122BS, or PBS in WT mice. (C) ddPCR quantification of human ST3GAL5 cDNA in the liver of WT mice with rAAV9.CB.hST3GAL5 or rAAV9.hSyn1.hST3GAL5.miR122BS treatments and endogenous mouse St3gal5 from PBS treatment. Data are reported as the mean ± SD of 3–4 animals/group. Statistical analysis was performed by 1-way ANOVA with post hoc Tukey multiple comparison test. (D) Volcano plots showing differentially expressed genes in mouse livers. Blue indicates reduced expression; red indicates increased expression; grey indicates ns difference. Adjusted P ≤ 0.05; fold change ≥ 2. (E) Graph depicting significantly enriched pathways for differentially expressed genes between livers from WT mice injected with PBS and rAAV9.CB.hST3GAL5 using gene set enrichment analysis. (F) Representative images of H&E staining of liver sections from WT mice injected with rAAV9.CB.hST3GAL5 or PBS or rAAV9.hSyn1.hST3GAL5.miR122BS. (G) Representative images of TUNEL staining of liver sections from WT mice injected with rAAV9.CB.hST3GAL5 or PBS or rAAV9.hSyn1.hST3GAL5.miR122BS. *P < 0.05, **P < 0.01. p.adjust, adjusted P value. Scale bar: 200 µm.

