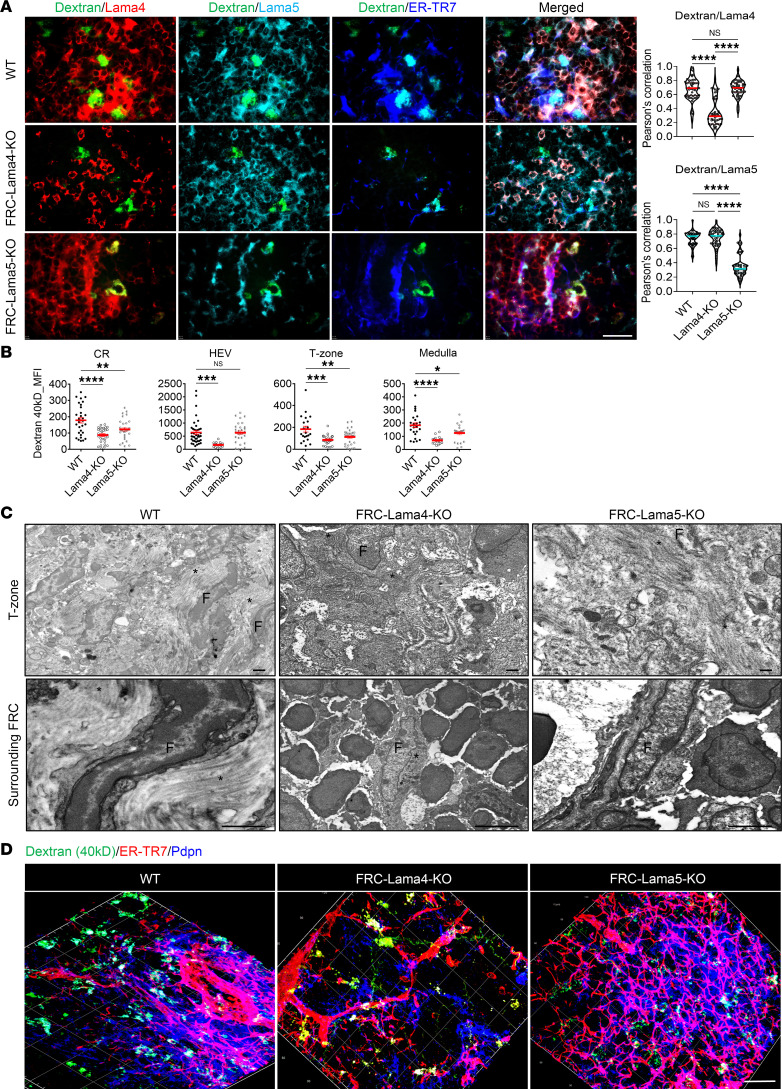
Figure 2. FRC Lama4 is necessary for intact collagen fibers and conduits.
(A) WT and KO mice received 2.5 μg dextran-FITC (40 kDa) s.c. The draining LNs were harvested after 2 minutes. LN cryosections (6 μm) were stained for Lama4, Lama5, and ER-TR7. Left: Fluorescence images (×20) of LN T cell zone. Scale bar: 100 μm. Right: Pearson’s correlation for colocalization of dextran-FITC with Lama4 and Lama5. (B) Quantification of dextran-FITC (40 kDa) in the CR, around HEVs, T zone, and medulla. (C) TEM images of WT, FRC-Lama4-KO, and FRC-Lama5-KO LNs (longitudinal section). Scale bars: 500 nm. Asterisks, collagen fibers; F, FRCs. (D) 3D confocal immunofluorescence image of 50-μm cryosections stained for ER-TR7 and Pdpn. Scale bar: 30 μm. Data in A–D are representative of 3 independent experiments; 3 mice/group, 5 LNs/mouse, 3 sections/LN, 3–5 fields/section. Data presented as mean ± SEM. *P < 0.05; **P < 0.01; ***P < 0.001; ****P < 0.0001 by 1-way ANOVA with Tukey’s multiple-comparison test (A and B).

