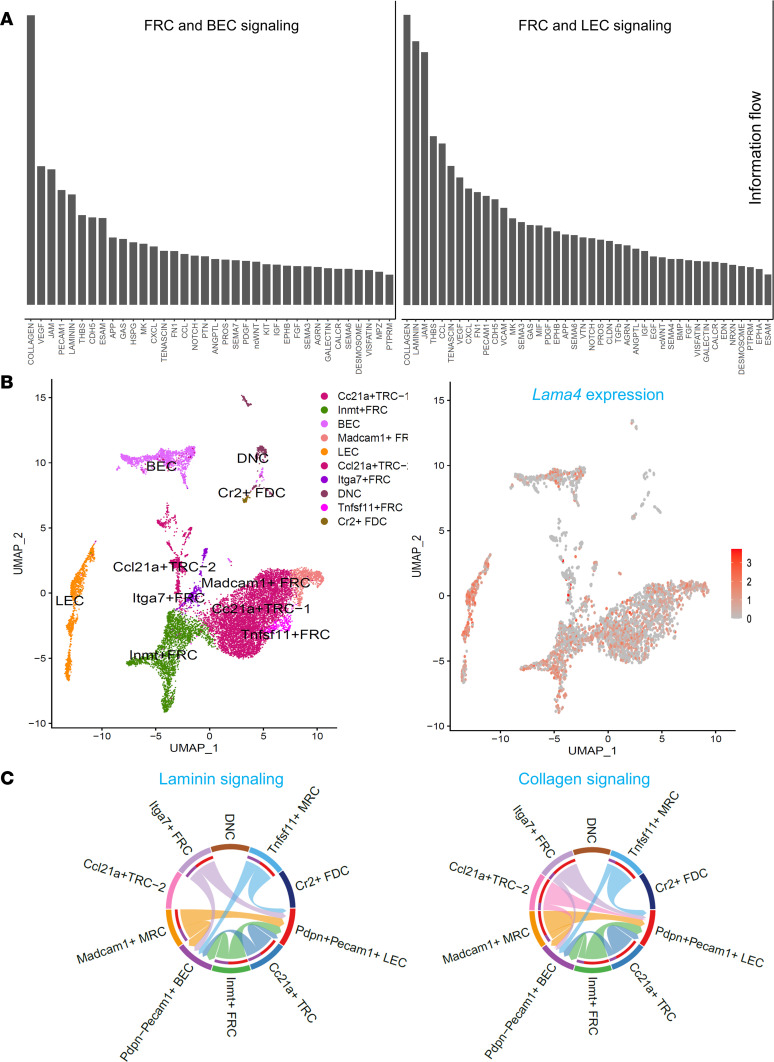
Figure 7. Lymph node stromal cell subsets crosstalk through laminin and collagen signaling pathways.
(A) Bar plot summarizing the number of interactions of significant signaling pathways based on information flow. (B) LNSC subsets identified by specific markers (left) and Lama4 gene expression (right) in these subsets. (C) Chord diagrams plotting signaling strength differences among different LNSC populations for the collagen and laminin pathways. Lines are the ligand-receptor interactions, and the relative thickness denotes strength. Outgoing signaling–targeted cell types represented by the color bars in the inner circles; outer color bars represent incoming signaling.

