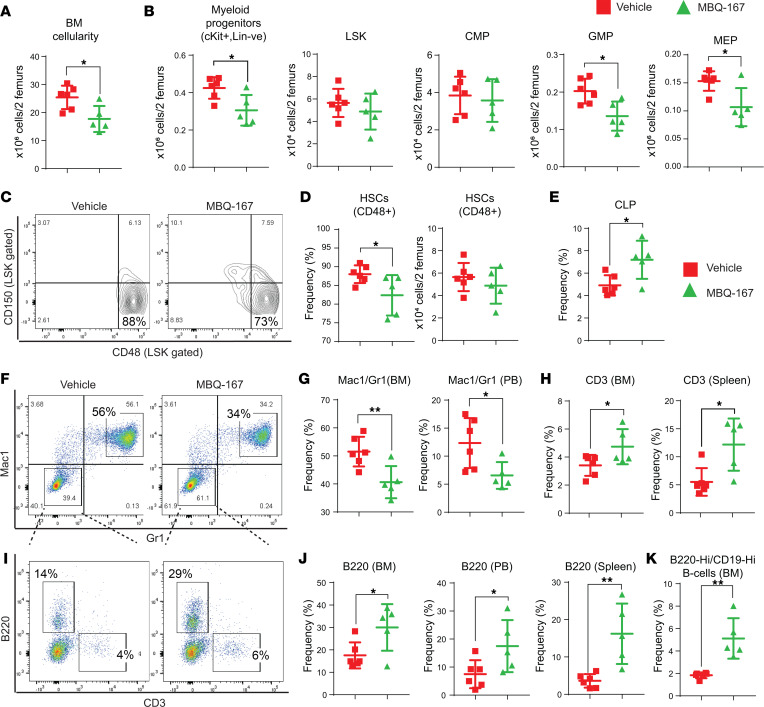
Figure 11. RAC/CDC42 pathway inhibition decreases Dnmt3a loss–induced myeloid skewing and improves B cells and T cells in mice.
(A) BM cellularity quantitation for 2 femurs in each mouse from mice transplanted with Dnmt3a–/– cells and treated with the vehicle or MBQ-167. n = 5–6, mean ± SEM, *P = 0.05. (B) Flow cytometry analysis was performed on BM cells from mice transplanted with Dnmt3a–/– cells and treated with vehicle or MBQ-167. Quantitative data showing the absolute number of Lin–cKit+ myeloid progenitors, Lin–cKit+Sca-1+ (LSKs), CMPs, GMPs, and MEPs. n = 5–6, mean ± SEM, *P = 0.05. (C and D) Flow cytometry analysis was performed on BM cells from mice in A, and representative dot plots for CD150- and CD48-stained (LSK gated) HSCs as shown in F; quantitative data plotted for the frequency and absolute number of CD150–CD48+ cells is shown in G. n = 5–6, mean ± SEM, *P = 0.05. (E) Representative data showing the frequency of CLPs in BM cells from mice transplanted with Dnmt3a–/– cells and treated with vehicle or MBQ-167. n = 5–6, mean ± SEM, *P = 0.05. Flow cytometry was performed on BM cells from vehicle- or MBQ-167–treated mice as in Figure 10A, and a representative dot plot for Mac1/Gr1 expression is shown in F and B220/CD3 cells in I. Quantitative data showing decreased Gr1+Mac1+ in BM and PB fractions (G); increased CD3+ T cells in BM and spleen fractions (H); increased B220+ B cells in BM, spleen, and in PB fractions (J); and increased B220hiCD19hi mature B cells in BM fractions (K) of drug-treated mice compared with controls. n = 5–6, mean ± SEM, *P = 0.05, **P = 0.005, unpaired t test (2-tailed) performed (B, D, E, G, H, J, and K).

