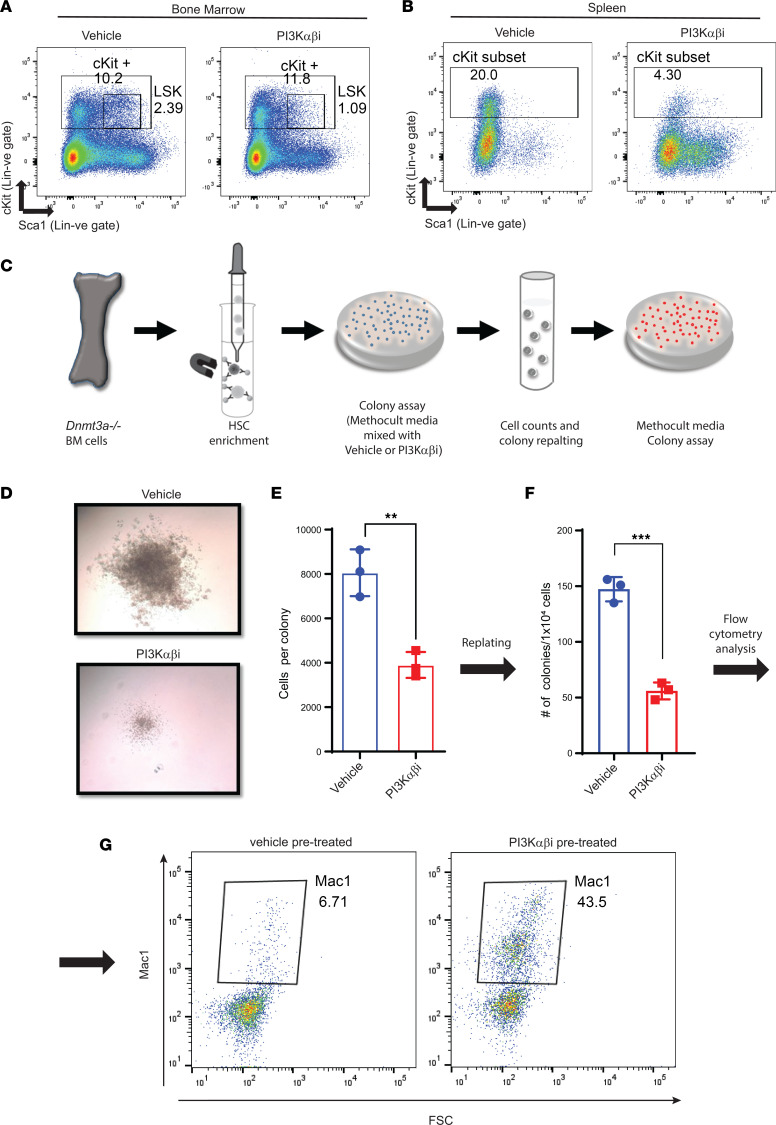
Figure 6. PI3K inhibition promotes cell differentiation in Dnmt3a-deleted hematopoietic stem cells.
(A and B) BM and spleen cells from mice transplanted with Dnmt3a–/– cells and treated with the PI3K αβ inhibitor were subjected to flow cytometry analysis to detect Lin–c-KIT+Sca-1+ cells. Representative dot plots showing Lin–c-KIT+Sca-1+ cells in BM (A) and spleen (B). (C) A schematic depicting our strategy to assess the impact of PI3K inhibitor on the ability of Dnmt3a–/– HSPCs to give rise to colonies in a methylcellulose-based assay in vitro. Briefly, HSPCs were enriched from the BM of Dnmt3a–/– mice and platted in a methylcellulose-based media, along with the PI3K inhibitor and cytokines (50 ng/mL rmSCF, 10 ng/mL rmIL-3, 10 ng/mL rhIL-6, 3 U/mL rhEPO, 10 ng/mL Flt-3, and 10 ng/mL thrombopoietin (TPO). Colonies were enumerated on day 7, and cells were replatted in methylcellulose media along with growth factors and colonies were scored again after secondary platting. (D) Equal number of cells (10,000 cells) were plated in methocult media and cultured for 1 week in the presence of PI3Kαβ inhibitor (250 nM) or vehicle. Representative colony images depicting reduced colony size under conditions of PI3K αβ inhibitor treatment compared with vehicle conditions. Experiment was performed in triplicate. Number of colonies and total number of cells per plate were quantified. (E) Quantitative data show average number of cells per colony in drug and vehicle treatment groups. n = 3, mean ± SD, **P = 0.005. (F) Quantitative data showing number of colonies after replatting cells derived from the vehicle- and drug-treated groups. n = 3, mean ± SD, ***P = 0.0005. (G) Flow cytometry analysis of secondary replatted colonies using an antibody against Mac1. Dot plots show the level of Mac1 expression in drug-treated versus vehicle-treated groups. Experiment was performed in triplicate. Unpaired t test (2-tailed) was performed in E and F.

