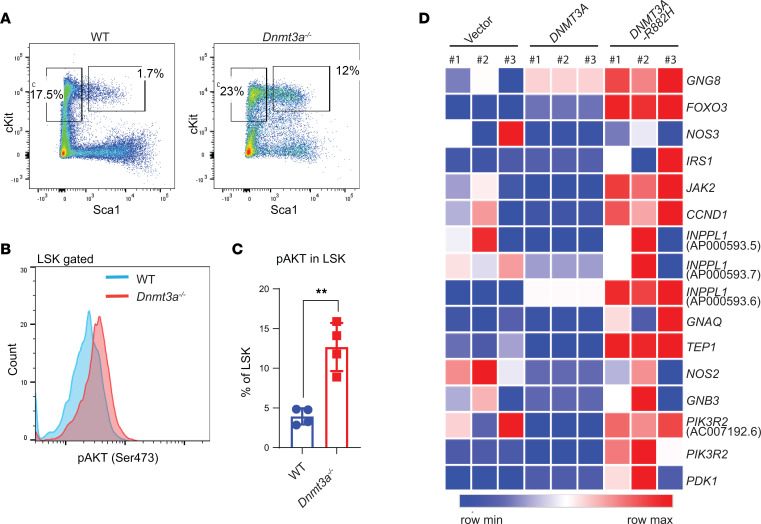
Figure 7. Increased PI3K signaling in Dnmt3a-deleted hematopoietic LSK cells and DNMT3A-mutated hCD34+ HSPCs.
(A) Flow cytometry analysis performed on BM cells collected from malignant Dnmt3a–/– and age-matched WT mice. Representative plots for Lin–Sca-1+cKit+ cells from the indicated genotypes are shown. (B) Histogram showing intracellular activation of Akt (Ser473) in LSK cells from indicated genotypes. (C) Quantitative data showing percent phospho-AKT+ LSKs relative to IgG controls. n = 4, mean ± SEM, unpaired t test (2-tailed), **P = 0.005. (D) CB CD34+ HSC/Ps were transduced with empty vector, DNMT3a-GFP, or DNMT3aR882H-GFP, and sorted GFP+ cells were subjected to RNA-Seq. Heatmap showing PI3K pathway related gene expression.

