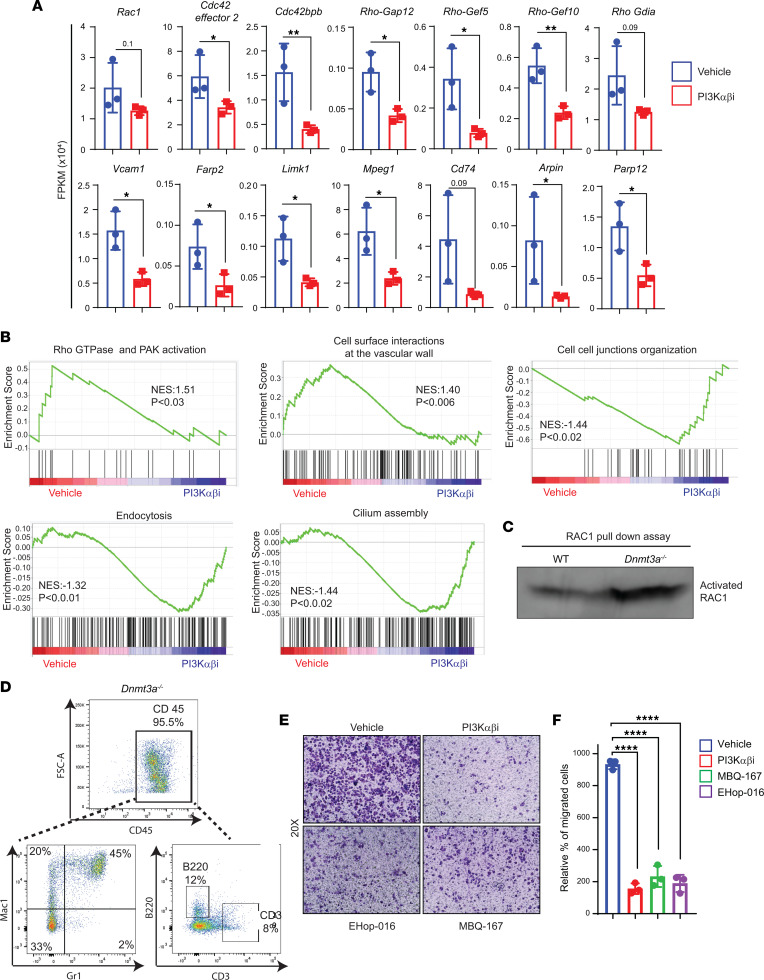
Figure 9. PI3K signaling promotes Dnmt3a loss–induced cell migration via RAC1 GTPase.
(A) Quantitative assessment of the level of expression of genes that belong to the RAC1/CDC42 pathway that are significantly reduced in PI3K drug–treated group compared with vehicle group. n = 3, mean ± SD, unpaired t test (2-tailed), *P = 0.05, **P = 0.005. (B) Gene set enrichment plots showing reduced RHO GTPase and PAK signaling associated with RAC1 pathway and altered biological processes in PI3K αβ inhibitor–treated Dnmt3a–/– BM cells compared with vehicle-treated group. (C) BM cells collected from WT or Dnmt3a–/– mice were subjected to activated RAC1 pulldown assay using PAK binding domain beads. Western blot analysis was performed to detect activated RAC1 using an anti-RAC1 specific antibody. Representative of 3 independent experiments shown. (D) Liver tissues harvested from hepatomegaly presenting malignant Dnmt3a–/– mice were subjected to CD45+ cell enrichment using magnetic cell separation, and percent CD45 enrichment was assessed using flow cytometry. Figure shows the percent of Mac1+, Gr1+, B220+, and CD3+ cells within the CD45+ enriched fraction of Dnmt3a–/– cells. (E and F) CD45+ cells (2.5 × 10⁵) enriched from Dnmt3a–/– mice livers as in D were subjected to transwell migration assay for 20 hours at 37°C in the presence or absence of 100 nM PI3K αβ inhibitor (Bay1082439), 0.5 μM RAC1/3 inhibitor (EHop-016), or 200 nM RAC/CDC42 inhibitor (MBQ-167). Migrated cells were stained with 0.1% crystal violet, and representative images (20× magnification) for treatments are shown. Quantitation of percent migrated cells is shown in F. n = 3, mean ± SD, 1-way ANOVA (Tukey’s multiple comparison test), ****P < 0.00001.

