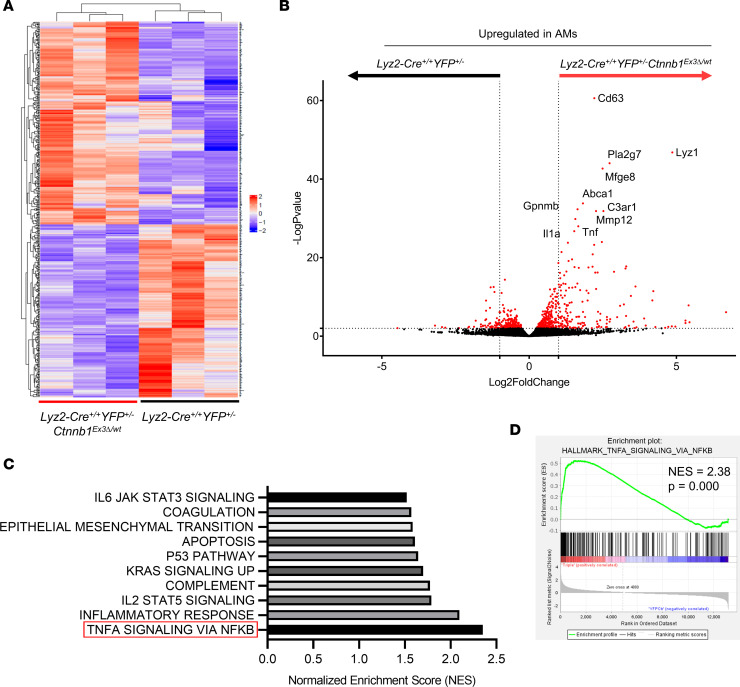
Figure 4. Comparative transcriptomic analysis of the activated β-catenin transcriptional program in AMs.
(A) Heatmap of top 500 DEGs in CD45+Ly6G–SSChiCD11c+Lyz2-EYFP+ AMs flow-sorted from the single-cell–dissociated lungs of non–tumor-bearing Lyz2-Cre+/+ YFP+/– Ctnnb1Ex3Δ/wt and Lyz2-Cre+/+ YFP+/– mice, as described in Supplemental Figure 4A; n = 3, Wald’s test with Benjamini-Hochberg correction. (B) DEGs in AMs of Lyz2-Cre+/+ YFP+/– Ctnnb1Ex3Δ/wt and Lyz2-Cre+/+ YFP+/– mice, cutoff of –logP ≥ 2 and 1 ≤ log2FC ≤ –1 highlighted in red and top 10 genes upregulated in Lyz2-Cre+/+ YFP+/– Ctnnb1Ex3Δ/wt relative to Lyz2-Cre+/+ YFP+/– mice labeled. (C) Ranked normalized enrichment scores (NES) from Gene Set Enrichment Analysis (GSEA) of Hallmark gene sets significantly upregulated in AMs of Lyz2-Cre+/+ YFP+/– Ctnnb1Ex3Δ/wt relative to Lyz2-Cre+/+ YFP+/– mice; NES ≥ 2 are highlighted. (D) GSEA plot for HALLMARK_TNFA_SIGNALING_VIA_NFKB gene set from C.

