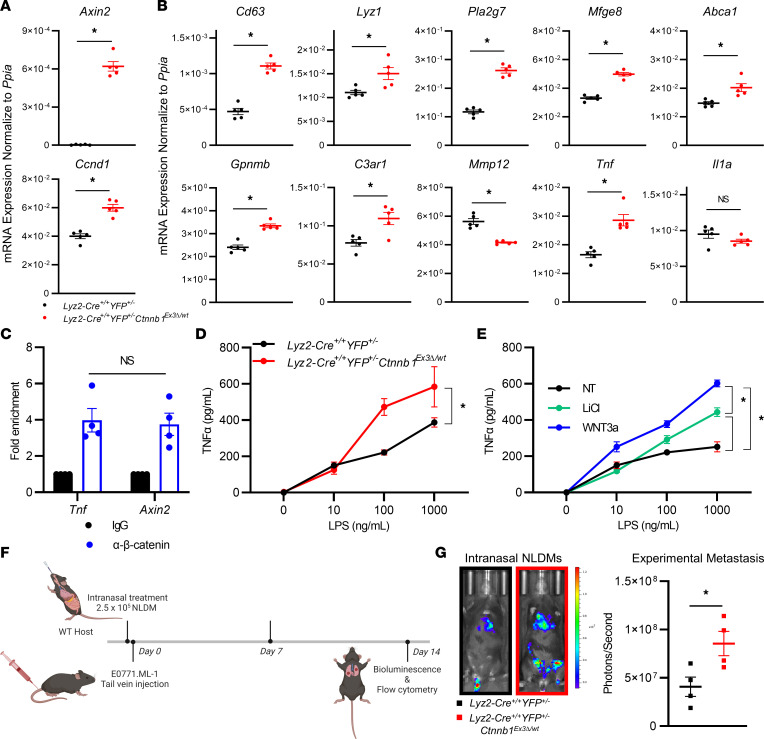
Figure 5. β-Catenin activity in NLDMs drives Tnf expression, and intranasal adoptive transfer of NLDMs with constitutively active β-catenin increases experimental metastasis.
(A) Lyz2-Cre+/+ YFP+/– Ctnnb1Ex3Δ/wt and Lyz2-Cre+/+ YFP+/– NLDM reverse transcription quantitative PCR (RT-qPCR) of Axin2 and Ccnd1. (B) NLDMs derived from Lyz2-Cre+/+ YFP+/– Ctnnb1Ex3Δ/wt and Lyz2-Cre+/+ YFP+/– mice analyzed by RT-qPCR for the top 10 upregulated DEGs identified in Figure 4B: Cd63, Lyz1, Pla2g7, Mfge8, Abca1, Gpnmb, C3ar1, Mmp12, Tnf, and Il1a. (C) CUT&RUN assay assessed by RT-qPCR for regions –408 and –340 of the Tnf and Axin2 genes, respectively, following incubation with anti–β-catenin antibody, and the data reported as fold enrichment over IgG background. (D) TNF-α ELISA using supernatants of Lyz2-Cre+/+ YFP+/– Ctnnb1Ex3Δ/wt or Lyz2-Cre+/+ YFP+/––derived NLDMs treated with or without LPS for 24 hours. (E) TNF-α ELISA of Lyz2-Cre+/+ YFP+/– –derived NLDMs ± 10 mM LiCl or 100 ng/mL recombinant Wnt3a. (F) Treatment schedule for intranasal NLDM adoptive transfer in WT hosts injected with E0771.ML-1 cells via the tail vein 36 hours after treatment. (G) Bioluminescence images and quantification of data at endpoint, representative of 4 individual mice. In all data panels the mean ± SEM values are shown and represent 5 (A and B) or 4 (G) individual mice, technical quadruplicate of 3 pooled biological samples (C), or biological triplicates (D and E). Statistical analysis is based on 2-tailed t tests (A–C and G), 2-way ANOVA (D and E); * = P < 0.05.

