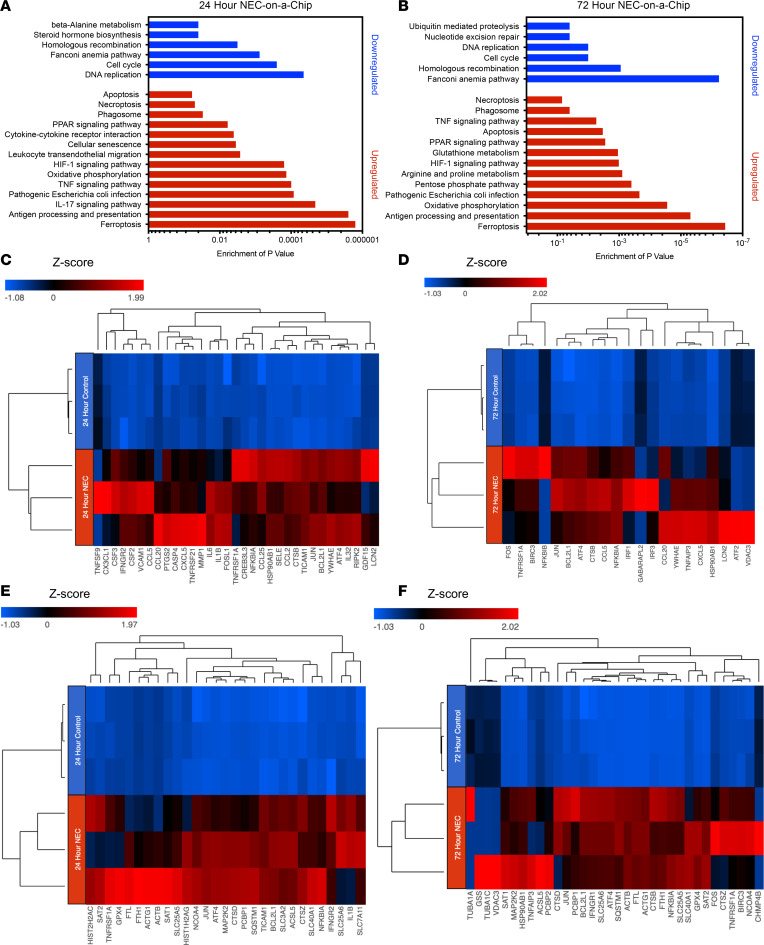
Figure 6. NEC-on-a-Chip contains a distinct profile of gene expression.
Functional enriched pathways provide a comparative analysis of NEC-on-a-Chip (n = 3 chips) compared with controls (n = 3 chips) at (A) 24 and (B) 72 hours. Heatmap representation of targeted genes in NEC-on-a-Chip reveals the most significantly upregulated genes in proinflammatory pathways at (C) 24 and (D) 72 hours and in pathways related to cellular death at (E) 24 and (F) 72 hours.

