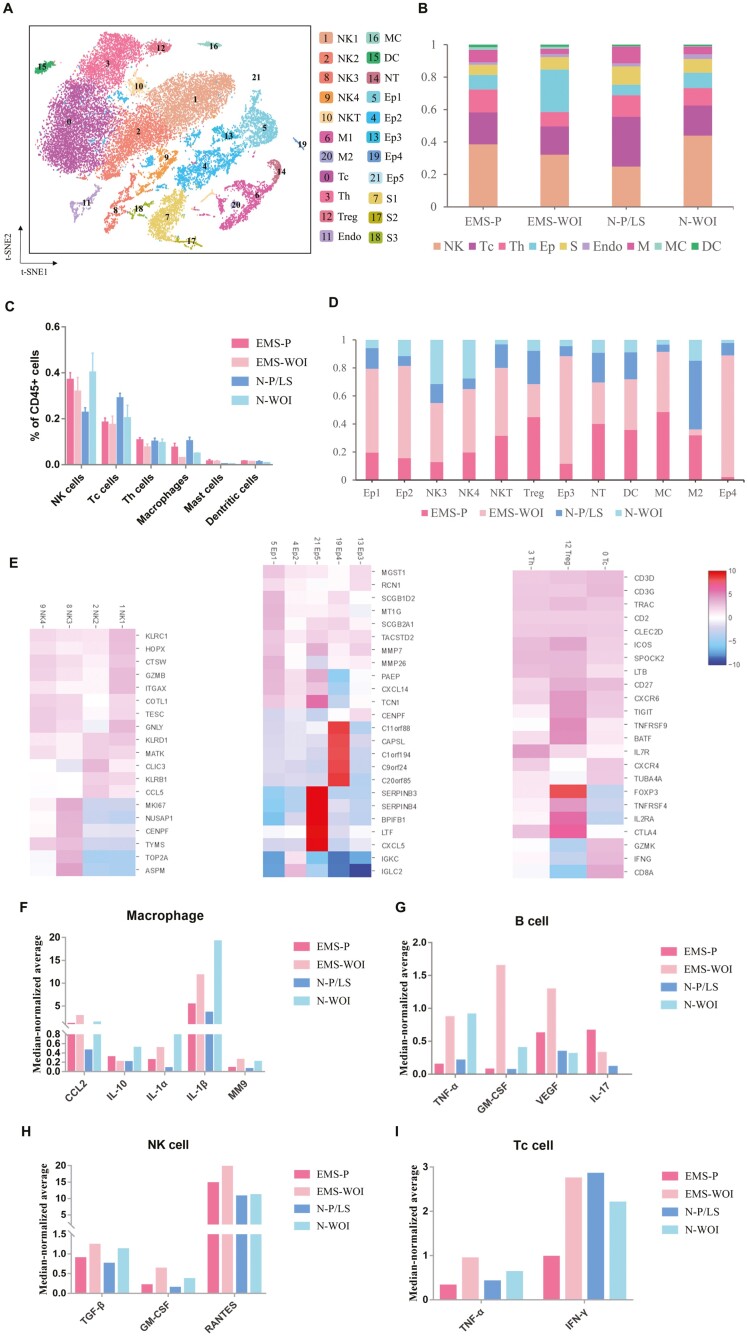
Figure 2:
Endometrial immune cell re-clustering in different menstrual phases and cytokine expression. (A) t-SNE projection of endometrial PTPRC+ cells from six patients with endometriosis and seven controls, identifying 22 clusters. (B) Bar plot representation of the relative frequency of different immune cell subclusters across the menstrual cycle. (C) Bar plot representation of the percentage of different immune cell subtypes. Data represent the mean ± SEM. (D) Bar plot representation of the relative ratio of the four groups (EMS-P, EMS-WOI, N-P/LS, and N-WOI) in 12 immune cell clusters. (E) Heatmap of gene expression in NK-cells, epithelial cells, T cells. (G–I) Cytokines expressed in endometrial immune cells. The y-axis shows the single-cell median-normalized average expression. S: stromal cell; Ep: epithelial cell; endo: endothelial cell; Th: T helper cell; Tc, Treg, regulatory T cell; T cytotoxic cell; NK: natural killer cell; M: macrophage; MC: mast cells; DC: dendritic cells; EMS-P: endometriosis in the proliferative phase; EMS-WOI: endometriosis in the window of implantation phase; N-P: control in the proliferative phase; N-P/LS: control in the proliferative phase and late secretory phase; N-S: control in the secretory phase; N-WOI: control in the window of implantation phase

