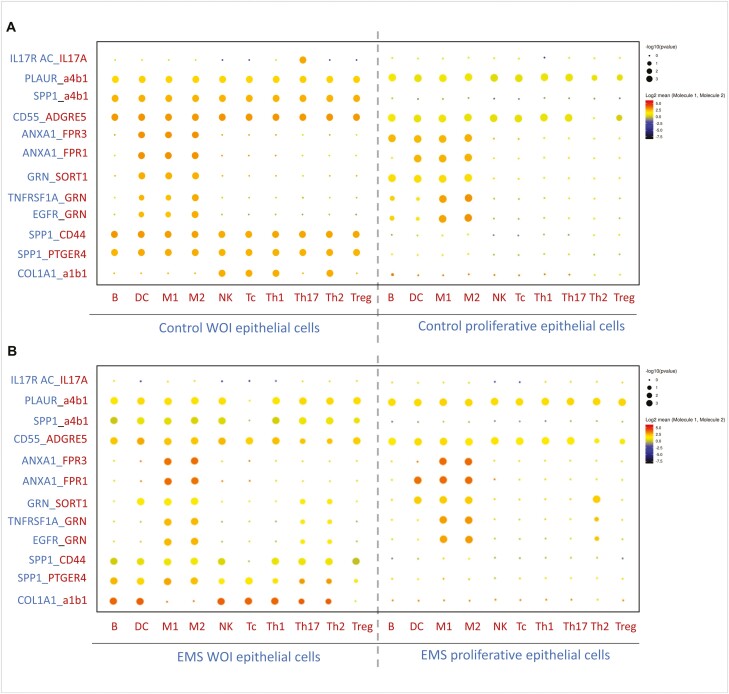
Figure 4:
Ligand–receptor analysis of endometrial cells in the endometriosis and control groups. (A) Dot plot of the predicted interactions of endometrial epithelial cells with immune cell subtypes during the window of implantation and in the proliferative phase of controls. (B) Dot plot of the predicted interactions of endometrial epithelial cells with immune cell subtypes in the secretory phase and proliferative phase in endometriosis. P values are indicated by circle size. The expression levels of all the interacting genes are indicated by color stripe on the right

