Figure 1.
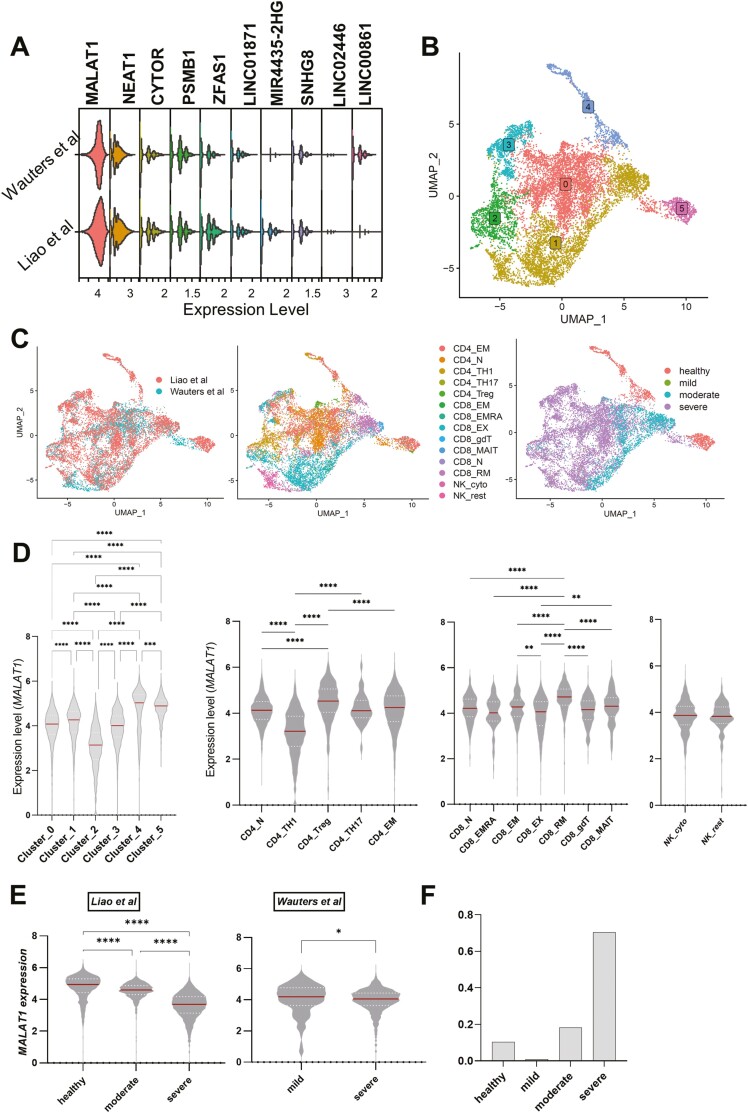
MALAT1 is differentially expressed in T cell subsets: (A) Stacked violin plots showing the top 10 highly expressed LncRNA in T cells in bronchoalveolar lavage fluid studies. (B) UMAP plots depicting single cells colored by their cluster identity as indicated by colored boxed labels. (C) UMAP plots depicting single cells colored and labeled by their respective study (Liao et al. (2020) and Wauters Mol et al. (2021)). Same as left but colored by imputed cell sub-population type and disease severity (healthy = 1225 (Liao et al. only), mild = 111, moderate = 2135, severe = 8275 T cells), respectively. (D) Violin plots showing normalized counts of MALAT1 expression across cluster identities of T cells and imputed cell sub-populations. Kruskal–Wallis multiple comparison P-values are indicated by asterisks (****P < 0.0001, ***P = 0.0001–0.005,**P = 0.005–0.001,*P = 0.01–0.05). For cell sub-populations, only a subset of comparisons is shown. (E) Violin plots showing normalized counts of MALAT1 expression across study and disease severity. Kruskal–Wallis multiple comparisons with p-value asterisks as defined in (D). (F) Barplot showing proportion of total CD4+/CD8 + T cells represented by each severity group pooled for both datasets.

