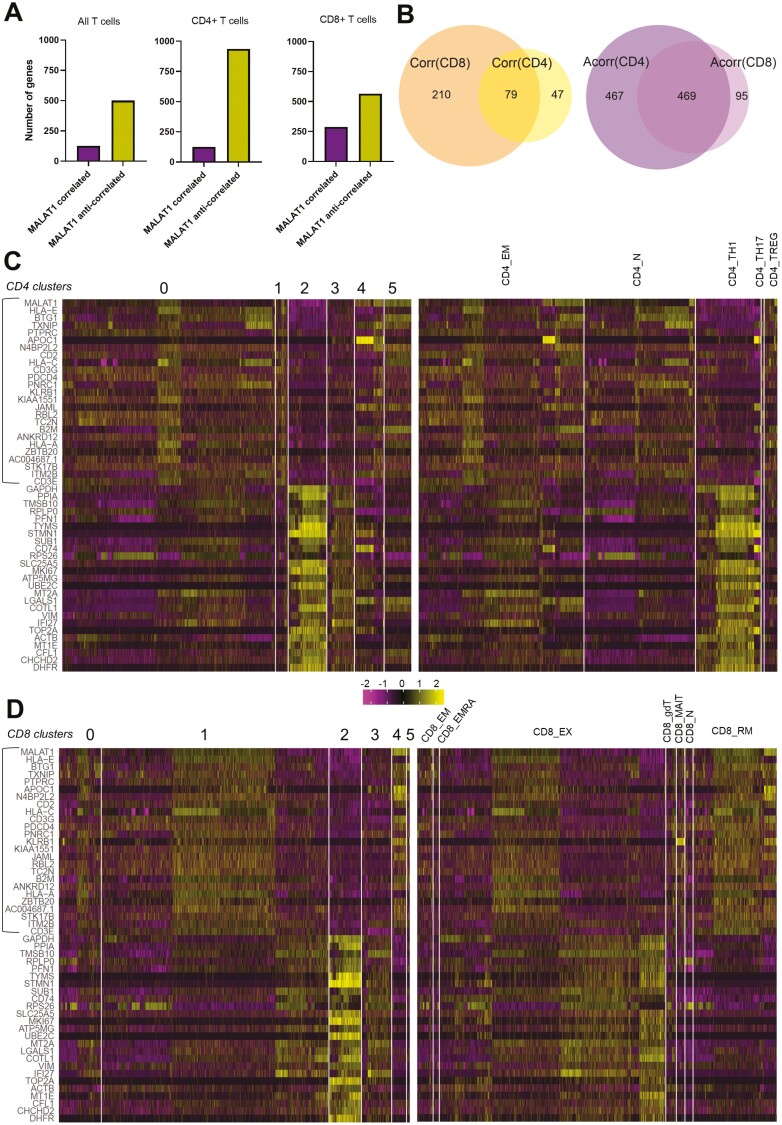
Figure 2.
BAL T-cell sub-populations differentially express MALAT1-correlated genes. (A) Bar plots showing the number of genes that correlate or anti-correlate with MALAT1 for all T cells, CD4+ and CD8+ T cells. (B) Venn diagrams depicting the intersection of gene lists that correlated [Corr(CD8), Corr(CD4)] and that for those that anti-correlated [Acorr(CD8), Acorr(CD4)] with MALAT1 expression in CD4+ cells and CD8+ cells. (C) Heatmap of top 25 MALAT1 correlating genes (highlighted in the rectangle) and top 25 anti-correlating genes in CD4 + T cells grouped by their cluster identities and by sub-population. Heatmap legend indicates expression values scaled to a mean of zero. (D) Same as C but for CD8+ T cells.

