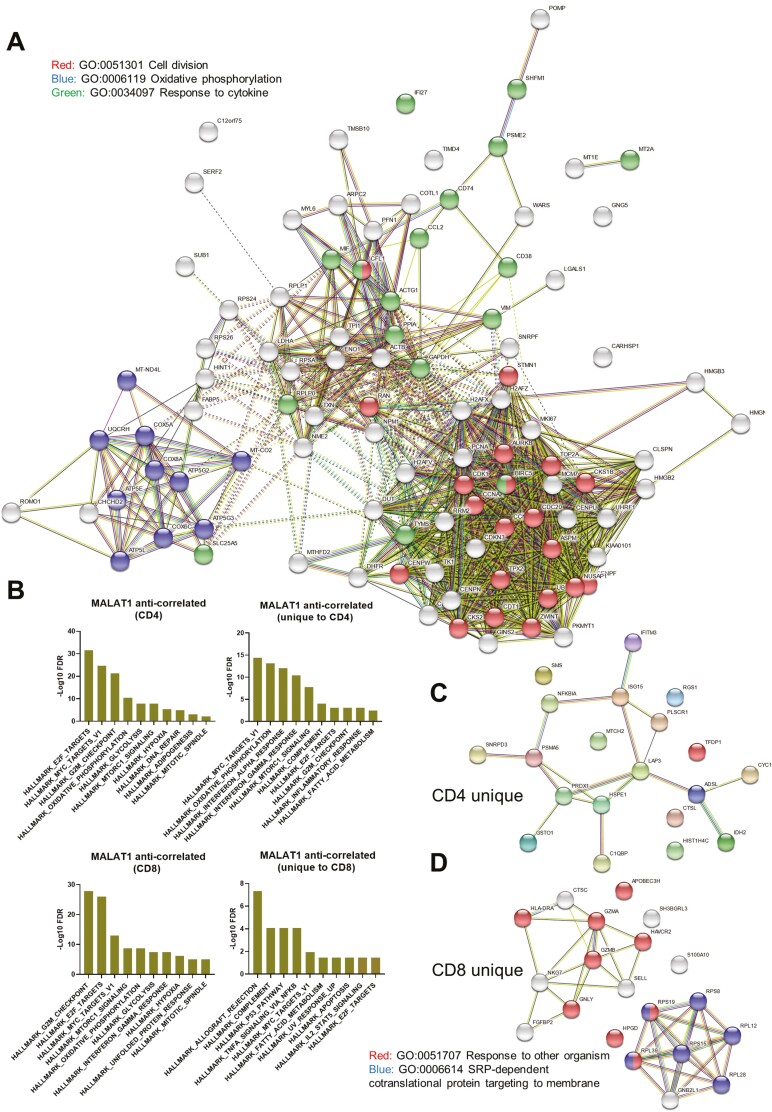
Figure 3.
MALAT1 anti-correlates to genes that are related to cell cycle progression in T cells. (A) Network representation of STRING interactions plotted for top 100 MALAT1 anti-correlated genes and those that are common in CD4+ and CD8+ T cells with lines indicating interconnectedness in terms of co-expression or interaction. (B) Barplots showing negative log FDR values for HALLMARK GSEA enrichment for genes that anti-correlate with MALAT1 and those that are uniquely so in CD4+ and CD8+ T cells. The ‘x’ axis contains HALLMARK gene set names that were found to enriched. (C) Same as A but for top 20 unique genes for CD4+ T cells. (D) Network representation of STRING interactions for top 20 unique CD8+ T cells.

