Figure 4.
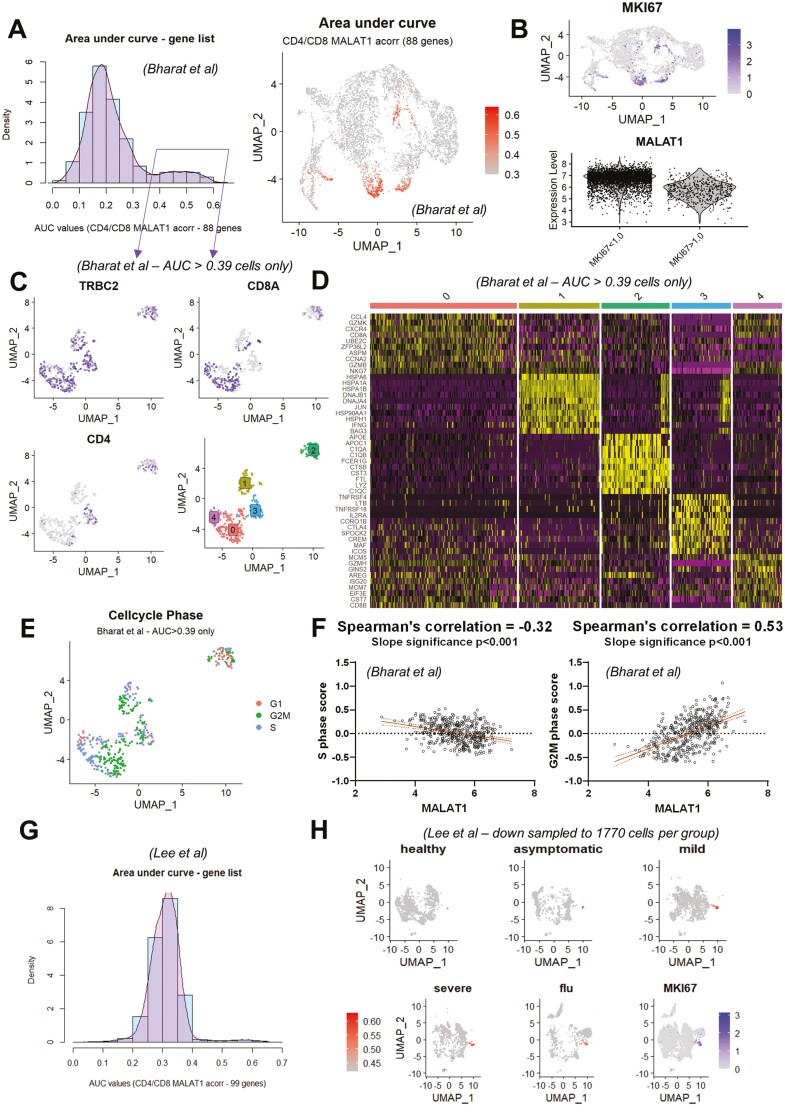
MALAT1 expression is reduced in proliferating T cells from lung digests. (A) Histogram showing ‘area under recovery curve’ score for MALAT1 anti-correlated gene list (number of genes = 88) for single cells. UMAP plot highlighting cells with AUC score from B that are greater than 0.39. (B) UMAP plot depicting MKI67 and a violin plot showing MALAT1 expression in groups created based on MKI67 levels of greater or less than 1.0. (C) UMAP plot depicting TRBC2, CD8A, and CD4 gene expression along with cluster identities of proliferative T cells (subset based on AUC score greater than 0.39 from A). (D)Heatmap showing top 10 genes expressed in each imputed cluster in (C). (E) UMAP plot depicting imputed cell cycle phase for each T cell. (F) Scatter plots and linear regression between imputed S-phase score (left) and G2/M score (right) per cell and MALAT1. P-values indicates the significance of the slope of the regression. (G) Histogram showing ‘area under recovery curve’ score for MALAT1 anti-correlated gene list (number of genes = 99) for PBMCs. (H) UMAP plot highlighting cells with AUC score in PBMCs from healthy volunteers and asymptomatic, mild, and severe COVID-19 patients and individuals with flu. The last UMAP shows MKI67 levels per cell.

