Figure 5.
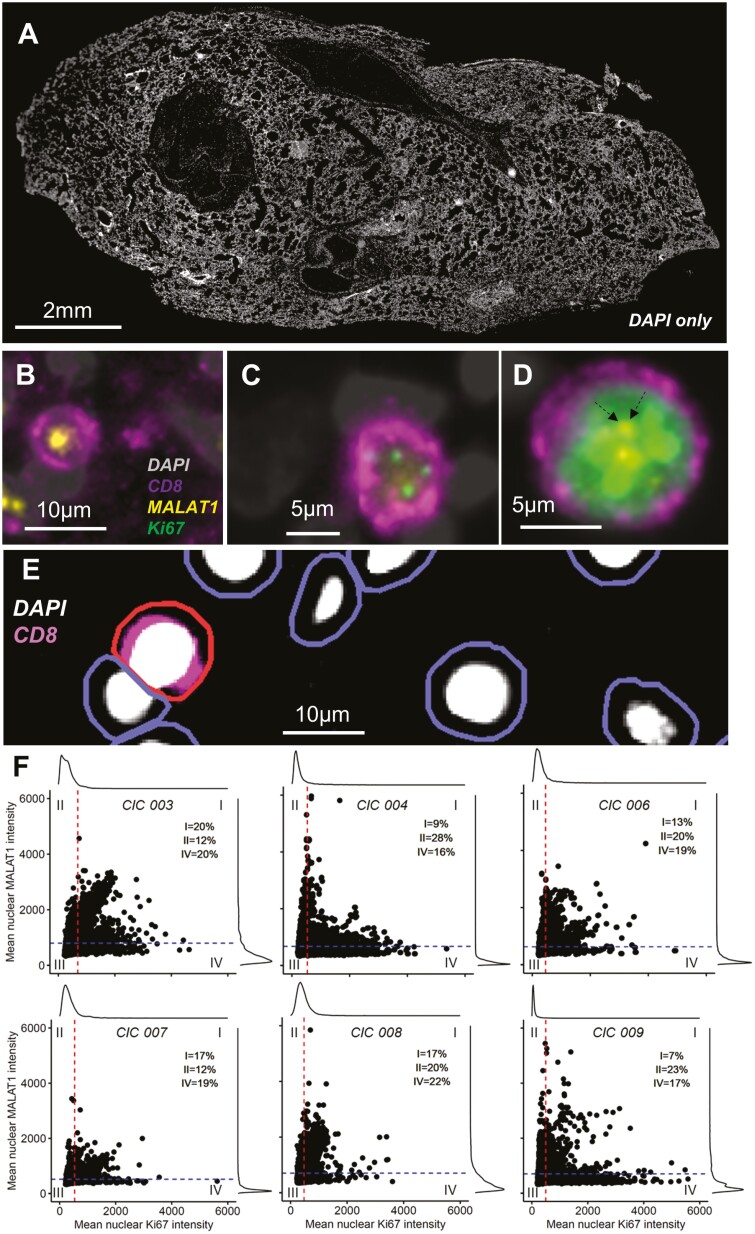
MALAT1 expression is reduced in proliferating CD8+ T cells post-mortem tissue. (A) DAPI stained (grey) whole lung autopsy section. (B–D), Immunofluorescence and RNAScope images showing nucleus in grey (DAPI), MKI67 protein in green, CD8 surface protein in purple and MALAT1 RNA in yellow. Images show representative cells negative for MKI67 and positive for MALAT1 (B), weakly positive for MIK67 and with undetectable MALAT1 (C) and highly expressing MKI67 along with MALAT1 (D). Dotted arrows in (D) highlight MALAT1 positive signal for clarity. (E) Strategy employed to detect cells wherein first nucleus was identified and then cell boundaries using QuPath (see Methods) and a positive cell was detected (shown here in red) based on CD8 fluorescence intensity of the cell. (F) Scatter/histogram plots per autopsy along with horizontal and vertical lines drawn at the mean nuclear MALAT1 (793, 671, 629, 516, and 703) and MKI67 (685, 530, 457, 534, and 476) intensities, respectively. The two straight lines divide the plot into four quadrants, into regions that include cells that highly express MKI67 only (IV), MALAT1 only (II), both (I), or neither (III).

