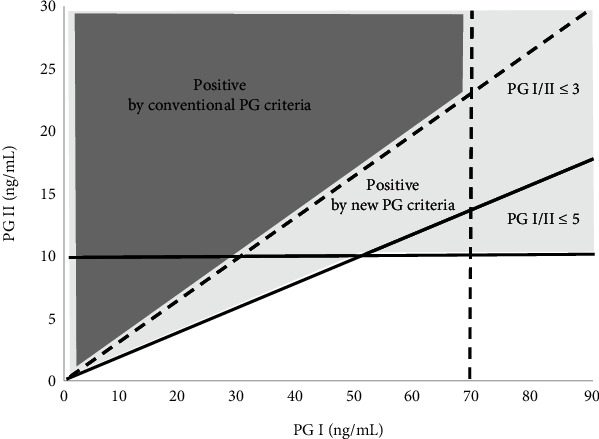
Figure 1.

Scheme showing the relation between the new and conventional serum PG criteria. Dotted lines are cutoff values for the conventional PG criteria (PG I ≤ 70 ng/mL and PG I/PG II ≤ 3). Straight lines are the cutoff values for the new PG criteria (PG II ≥ 10 ng/mL or PG I/PG II ≤ 5). The light gray area shows the high-risk subjects based on the new PG criteria, whereas the dark gray area shows the high-risk subjects based on the conventional PG criteria. The new PG criteria are a necessary condition for the conventional PG criteria.
