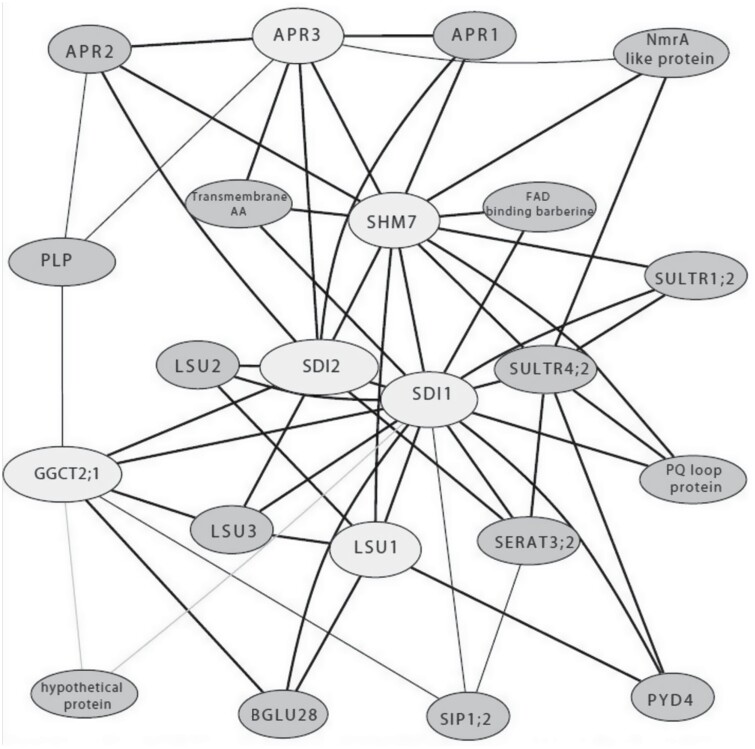
Fig. 2.
The extended OAS cluster co-expression gene network from ATTED-II. The six OAS cluster genes (light gray color) were used as query genes on the ATTED-II database. The ATTED-II contains data derived from RNA-seq (Ath-r.c5-0 platform) and microarray (Ath-m.c9-0). An additional 16 genes (dark gray color) were found to be stably co-regulated with the six core OAS cluster genes. Among them, several genes are known to be associated with sulfur metabolism and response to sulfur deprivation, such as APRs, LSUs, SULTRs, and SERAT3;2. The z-score is a factor which indicates the stability of the co-expression. The thicker line, which connects two genes, indicates a higher z-score displaying a higher degree of co-expression between the two genes. The thinner the line is, the lower the z-score is. A lower z-score indicates lower stability of co-expression of the two genes.

